


The headline figure for the Philippines casino market size 2026 is less straightforward than a single growth rate suggests. Philippine gross gaming revenue reached PHP396.14 billion in 2025, up from PHP372.33 billion in 2024, yet electronic gaming generated PHP201.12 billion, more than half of the total. PAGCOR has since indicated that 2026 gaming GGR could fall within PHP320 billion to PHP350 billion, while independent forecasts point to a 3% to 7% contraction, depending on the assumptions used. Business Inquirer's 2025 GGR report PAGCOR's H1 2025 disclosure PAGCOR's 2026 forecast coverage
For operators, suppliers, investors, affiliates, and regulators, the important question is no longer how large the market is. It's which revenue pools are expanding, which are stabilising, and which are exposed to regulatory or consumer pressure.
Table of Contents
- What the 2026 Philippines Casino Outlook Actually Says
- How to Read PAGCOR GGR Without Getting Misled
- How the Market Got Here From 2022 to 2026
- Three 2026 Scenarios for the Philippines Casino Market
- Drivers and Constraints Shaping 2026 Casino Revenue
- Operator Landscape and Segment Exposure
- What Operators, Affiliates and Investors Should Do Next
- Methodology, Sources and Quick Answers
What the 2026 Philippines Casino Outlook Actually Says
The 2025 result provides the clearest starting point. Philippine gaming GGR reached PHP396.14 billion, equivalent to approximately US$6.6 billion in the reporting cited by Business Inquirer. The market therefore entered 2026 at substantial scale, but with a radically different composition from the traditional casino model. Business Inquirer reported the 2025 industry result and revenue mix.
PAGCOR's 2026 guidance is materially more cautious. The regulator has forecast total gaming GGR of PHP320 billion to PHP350 billion, implying a weaker year than 2025 if the range is reached. Independent forecasts have also called for contraction, with one benchmark pointing to a 7% decline and another modelling a 3% decline. Yogonet reported PAGCOR's PHP320 billion to PHP350 billion range CDC Gaming reported the independent 2026 decline forecast
The three revenue buckets
A defensible market view separates:
- Licensed casinos, including integrated-resort operators such as City of Dreams, Okada, Solaire, and Resorts World.
- PAGCOR-operated venues, including Casino Filipino properties.
- Electronic gaming, covering eGames, bingo, and eBingo categories reported within the broader gaming framework.
Licensed casinos generated PHP182.5 billion in 2025, while PAGCOR-operated casinos contributed PHP12.52 billion. Electronic gaming reached PHP201.12 billion, meaning digital-led products had become the largest reported pool. The 2025 segment figures are detailed in Business Inquirer's market report.
| Metric | 2025A (PHP bn) | 2026 PAGCOR Guidance (PHP bn) | 2026 Independent Forecast (PHP bn) | YoY Change |
|---|---|---|---|---|
| Total gaming GGR | 396.14 | 320 to 350 | Down 3% to 7% | Contraction indicated |
| Licensed casinos | 182.50 | Not separately forecast | Not separately forecast | Down in 2025 |
| PAGCOR-operated casinos | 12.52 | Not separately forecast | Not separately forecast | Segment-specific outlook unavailable |
| Electronic gaming | 201.12 | Not separately forecast | Not separately forecast | Dominant 2025 pool |
The distinction matters because a flat total could hide a major shift between VIP baccarat, mass tables, electronic gaming machines, and online products. Integrated resorts in Metro Manila, Clark, and Cebu may recover unevenly even while the broader market contracts. The most useful 2026 analysis therefore tracks channel mix and segment resilience, not just the annual topline.
How to Read PAGCOR GGR Without Getting Misled
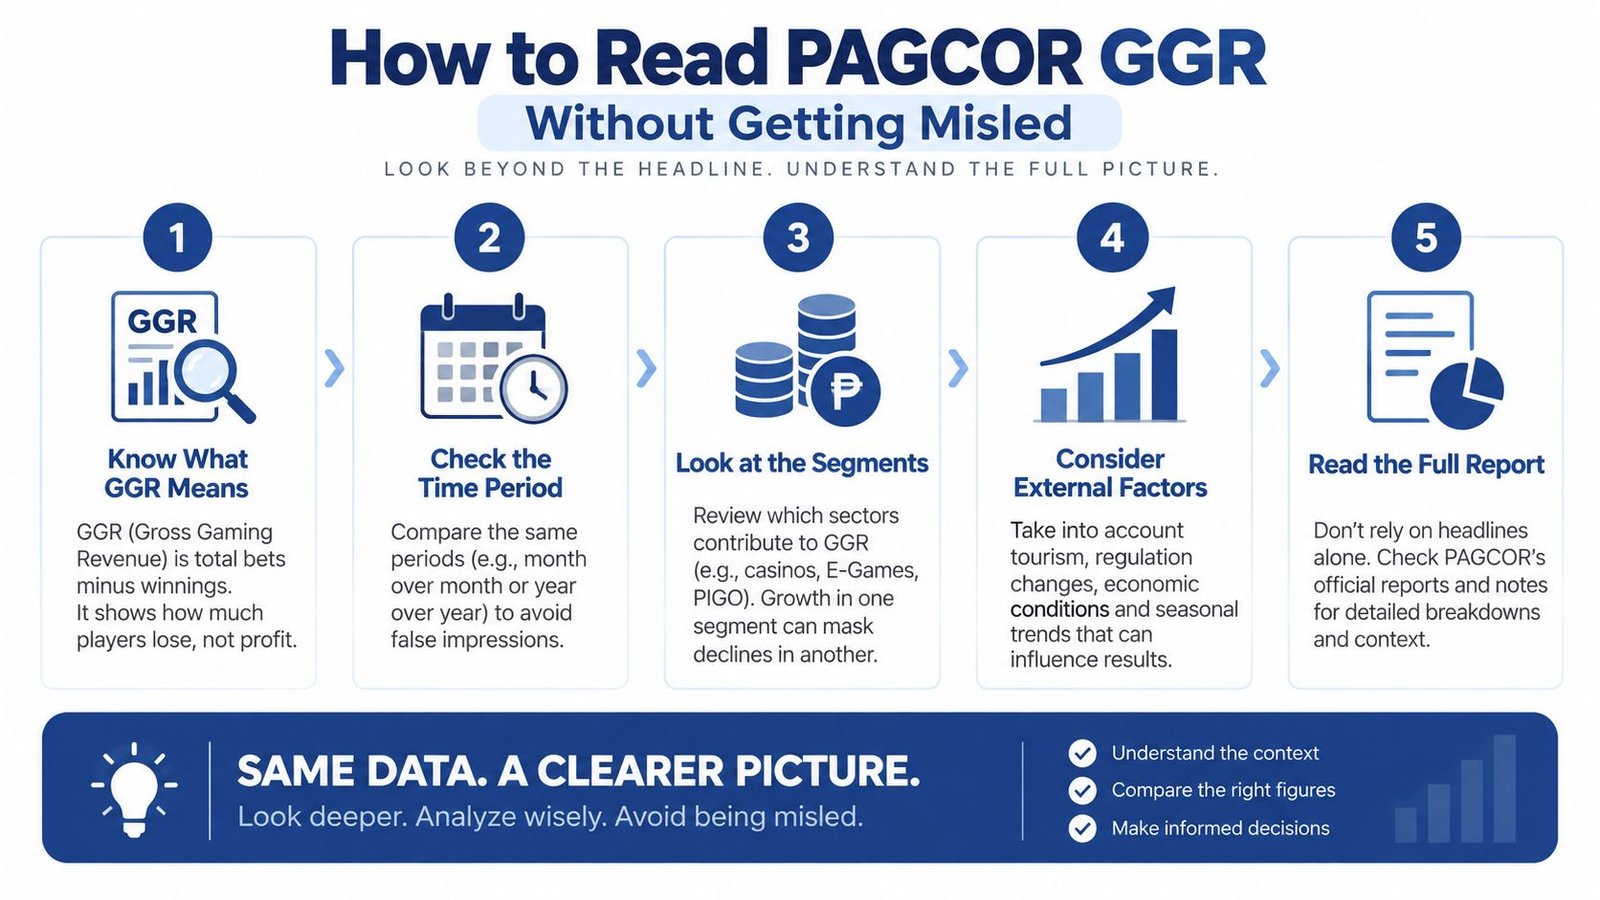
PAGCOR's disclosures should be read as a segmented revenue statement, not as a direct measure of private casino revenue. Gross gaming revenue, or GGR, represents wagers retained after player winnings and before operating costs. It isn't the same as net profit, cash flow, or the government's eventual share.
The first line to isolate is Licensed Casinos. This captures private, licensed brick-and-mortar operators and is the closest headline proxy for the physical casino segment. The second is PAGCOR-operated casinos, which reflects Casino Filipino venues owned and operated by the regulator. The third is Electronic Games, a broader category that can include eGames, bingo, eBingo, and other electronically delivered products depending on the reporting period.
A five-step reading method
Start with total industry GGR. This establishes the size of the broad gaming market, not the land-based casino market alone.
Remove the categories that don't match the research question. A physical-casino TAM should exclude electronic gaming and any non-casino activity included in the regulator's total.
Separate private operators from PAGCOR venues. Casino Filipino revenue belongs to a government-operated segment and shouldn't be presented as integrated-resort revenue.
Keep the period consistent. Quarterly figures shouldn't be annualised without a scenario adjustment, particularly when recent quarters have shown volatility.
Convert currencies consistently. USD comparisons require one stated exchange-rate convention, while inflation adjustments require a consistent Philippine price index. Without those controls, cross-period comparisons can create false precision.
PAGCOR's Q1 2026 disclosure illustrates the issue. Total industry GGR was PHP87.60 billion, licensed casinos contributed PHP44.52 billion, and electronic gaming produced PHP39.90 billion. PAGCOR's official disclosure provides the Q1 2026 breakdown. Treating PHP87.60 billion as casino revenue would overstate the physical-casino opportunity.
For readers comparing licensed online products and regulator-defined categories, the PAGCOR online casino framework provides useful market context. Analysts should still verify whether each source uses the same definition of online gaming, electronic gaming, bingo, and sports-related activity.
Practical rule: A market-size model should show total gaming GGR, licensed-casino GGR, PAGCOR-operated GGR, and electronic gaming GGR in separate rows.
How the Market Got Here From 2022 to 2026
The Philippines gaming market moved through a reopening phase, a VIP recovery, and then a digital-led reallocation. PAGCOR noted that total industry GGR rose from US$3.75 billion in 2022 to US$6.5 billion in 2024, with a US$7 billion target for 2025. Those figures establish the speed of the market's expansion before the 2026 slowdown. PAGCOR's historical and target figures were reported by Business Inquirer.
The land-based segment remained substantial during the first half of 2025. Licensed casinos produced PHP93.36 billion, representing 43.47% of total industry GGR of PHP214.75 billion, while PAGCOR-operated casinos contributed PHP6.56 billion, or 3.06%. The first quarter then marked a structural pivot, as electronic games overtook licensed casinos for the first time. PAGCOR's H1 2025 release records the licensed-casino and Casino Filipino contributions.
The transition in four stages
Reopening: Physical casinos regained activity as travel and hospitality resumed, but the recovery did not immediately restore every mass-market pattern.
VIP rebound: Premium play returned unevenly, making integrated-resort performance more sensitive to international travel and high-value customer flows.
Electronic expansion: eGames, bingo, and eBingo gained scale across a wider geographic footprint, reducing the market's dependence on Manila's flagship resorts.
2026 consolidation: Q1 and Q2 disclosures show a narrowing gap between licensed casinos and electronic gaming, but also a softer total market. PAGCOR's Q1 2026 figures show licensed casinos at PHP44.52 billion and electronic gaming at PHP39.90 billion. In Q2, licensed casinos reached PHP45.37 billion, while electronic gaming generated PHP39.85 billion. The Q2 2026 breakdown was reported by Inquirer.
The analytical conclusion is subtle. Electronic gaming has changed the market's centre of gravity, but licensed casinos haven't become irrelevant. Their quarterly GGR remained above PHP44 billion in both disclosed 2026 quarters, even as total industry GGR weakened. Operators assessing licensing, technology, or B2B opportunities should therefore model digital growth and land-based resilience as competing but simultaneous realities.
Suppliers entering the market also need to distinguish product demand from licensing demand. PAGCOR's B2B provider application process is relevant to vendors assessing how compliance, distribution, and channel access affect expansion.
Three 2026 Scenarios for the Philippines Casino Market
PAGCOR's PHP320 billion to PHP350 billion guidance should be treated as a planning corridor, not a guaranteed midpoint. The latest quarterly disclosures add downside evidence, with Q1 2026 GGR at PHP87.60 billion, down 15.87% year on year, and Q2 GGR at PHP88.13 billion, down 20.33%. PAGCOR's Q1 disclosure Inquirer's Q2 report
The following scenarios are analytical frameworks, not official forecasts. No probability weight is assigned because the verified data don't provide one.
| Scenario | Total GGR (PHP bn) | Licensed Casinos | PAGCOR Venues & E-Games | Licensed iGaming | Key Trigger |
|---|---|---|---|---|---|
| Base | 320 to 350 | Stable to softer | Electronic gaming remains material but volatile | Dependent on regulatory clarity | PAGCOR guidance broadly holds |
| High | Above the guidance corridor | Recovery in mass and premium play | Electronic gaming stabilises or expands | Clearer licensed framework | Stronger tourism and premium demand |
| Low | Below the guidance corridor | Further pressure on discretionary demand | Electronic gaming contracts under tighter enforcement | Delayed or restricted expansion | Continued quarterly weakness |
What would move each case
Base case: The market remains flat to down, with licensed casinos holding share while electronic gaming absorbs regulatory and consumer pressure. Q1 and Q2 trajectories would need to stabilise rather than continue deteriorating.
High case: A stronger recovery in international premium demand would help integrated resorts, while improving mass-market traffic would support table games and electronic machine performance. The upside would be concentrated, not evenly distributed across every operator.
Low case: Tighter online enforcement, weaker discretionary spending, and continued electronic-gaming volatility would pull the market below PAGCOR's corridor. Land-based venues could still hold relative share while total GGR contracts.
Operators should monitor monthly electronic-game GGR, licensed-casino quarterly GGR, visitor demand indicators, and changes in online licensing. The most fragile assumption is uniform growth across channels. The most credible upside is selective recovery in land-based premium and mass segments, provided consumer and regulatory conditions improve.
Drivers and Constraints Shaping 2026 Casino Revenue
The 2026 market will turn on a small number of identifiable levers. The quarterly data already show that electronic gaming weakness can pull down total GGR even when licensed casinos retain majority share. That makes segment-specific monitoring more useful than broad industry sentiment. Q1 2026 data from PAGCOR Q2 2026 data from Inquirer
Potential upside
International tourism would support premium and mass play at integrated resorts, particularly in Metro Manila, Clark, and Cebu. A recovery in Chinese demand could improve VIP and premium-mass volumes, but the verified data don't establish a confirmed scale or timing for that recovery.
New and expanding resort capacity could also redirect spending toward land-based properties. The commercial effect would depend on table yield, hotel occupancy, non-gaming traffic, and customer acquisition, rather than on floor capacity alone.
Payment convenience is another operational lever. Faster peso and QR-based payment rails can reduce friction for domestic customers, although no verified source in the available data quantifies the resulting revenue effect. Operators should validate payment improvements against transaction completion, deposit frequency, withdrawal speed, and responsible-gambling controls.
Constraints requiring closer attention
Regulatory pressure: PAGCOR has linked its 2026 forecast to pressure on online gambling and softer consumer spending. Yogonet's report on PAGCOR's forecast
Electronic-gaming exposure: Electronic gaming generated PHP201.12 billion in 2025, so any enforcement or demand shock in that category can materially affect total GGR. Business Inquirer's segment reporting
Mass-market pressure: Inflation and softer discretionary spending can affect domestic visits, food and beverage spend, hotel demand, and lower-value gaming sessions together.
Junket and credit scrutiny: Premium revenue requires strong source-of-funds, credit, and responsible-gambling controls. Operators should not treat VIP recovery as risk-free volume.
The GCash withdrawal context for Philippine online casino users is relevant to payment and compliance discussions, but payment access must remain subordinate to licensing, identity verification, and responsible-gambling requirements.

Operator Landscape and Segment Exposure
The competitive dynamic is best understood through exposure rather than a simple ranking by brand recognition. Integrated resorts carry concentrated fixed costs and depend on a blend of VIP, premium mass, mass tables, electronic machines, hotel revenue, and non-gaming amenities. PAGCOR-operated venues serve a different strategic role, while online and eGames operators face greater sensitivity to licensing and enforcement changes.
Exposure by operator group
Integrated resorts in Metro Manila include Okada, Resorts World, Solaire, and Westside City. Clark and Cebu add geographic diversification, but each property's performance depends on its local customer base, tourism flows, premium demand, and development pipeline. These operators are most exposed to capital intensity and international travel, but they also have the clearest upside if land-based demand recovers.
Mid-tier casinos and Casino Filipino venues are more closely connected to domestic mass demand. Their cost structures, locations, and customer profiles differ from flagship integrated resorts, so they shouldn't be valued using the same revenue assumptions.
Online and electronic operators, including the broader eGames ecosystem and companies such as DigiPlus, face a different trade-off. They can capture digital demand without the same hotel and resort footprint, but their revenue is more directly exposed to regulatory changes affecting electronic and online products.
Bloomberry and other integrated-resort-linked businesses may have stronger access to land-based recovery, while tier-two electronic operators could face margin compression if duties, compliance costs, or enforcement intensify. The verified data don't support a precise operator league table, so exposure should be scored qualitatively across four criteria:
- Channel dependence: land-based, electronic, or mixed.
- Customer dependence: domestic mass, premium mass, VIP, or digital.
- Regulatory sensitivity: low, moderate, or high.
- Capital flexibility: ability to redirect investment toward resilient segments.
M&A optionality may become more relevant if owners rationalise non-core assets, but no verified transaction data are available to confirm an active consolidation wave. Investors should therefore avoid pricing hypothetical deals as current market facts.
For real-money online activity, Philippine online casino market context can help affiliates and suppliers frame channel exposure without treating online revenue as interchangeable with licensed-casino GGR.
What Operators, Affiliates and Investors Should Do Next
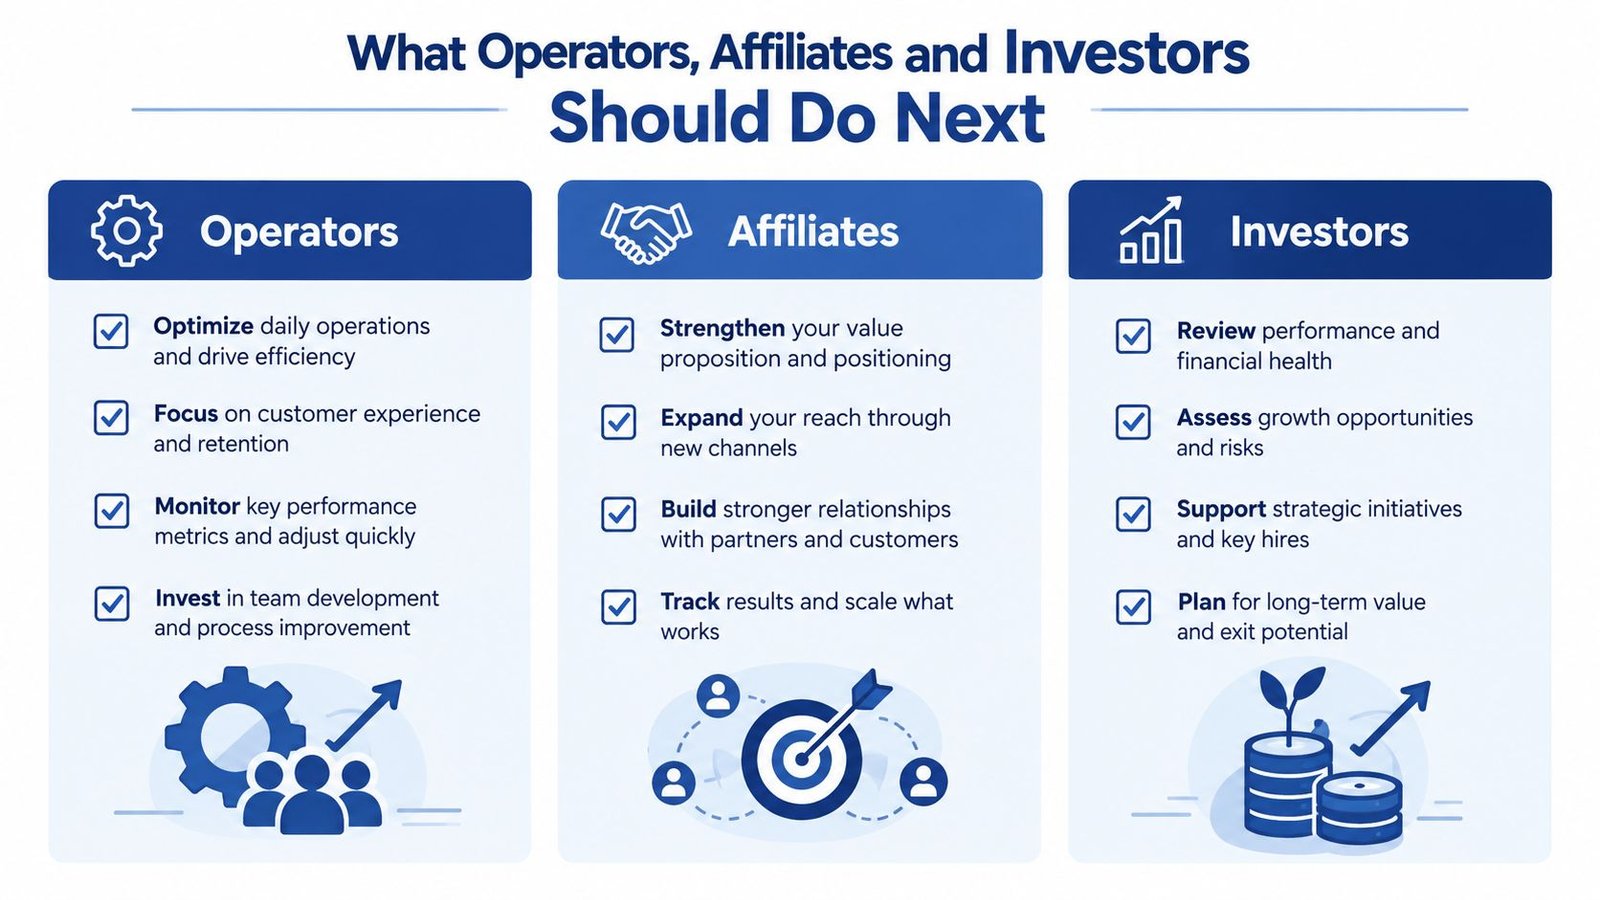
The 2026 outlook calls for different decisions by segment. A resort operator shouldn't copy an eGames operator's acquisition plan, and an investor shouldn't treat PAGCOR-operated venues as a proxy for private integrated-resort performance.
Integrated-resort operators
Priorities should centre on yield quality and customer mix. Manila and Clark properties can protect premium demand through targeted VIP reinvestment, while Cebu offers a potential mass-market and tourism diversification angle. Operators should also bundle gaming with rooms, food and beverage, entertainment, and conventions so that customer value doesn't depend on a single gaming session.
The operating dashboard should separate VIP, premium mass, mass tables, electronic machines, hotel demand, and non-gaming spend. That separation will reveal whether revenue gains reflect genuine customer breadth or concentration among a narrow group of high-value players.
Online operators and affiliates
Licensed online operators should focus on retained player economics, identity controls, source-of-funds checks, and payment-rail resilience. GCash and QRPH may support convenience, but every payment path still needs reconciliation, fraud monitoring, withdrawal controls, and responsible-gambling safeguards.
Affiliates should shift toward compliant content around licensed operators and clearly distinguish online products from land-based casinos. Keyword strategy can broaden beyond VIP terms toward mass-market search intent, payment education, licensing, game formats, and safer-play information. Customer acquisition cost should be evaluated alongside retention and compliance costs, not in isolation. A guide to user acquisition cost provides relevant commercial context for that analysis.
Top 1 Rank is one example of a publication covering iGaming intelligence, operator developments, compliance, market research, and casino analytics. Its editorial approach can sit alongside regulator disclosures, filings, and specialist data services rather than replace primary verification.
Investors
Capital allocation should distinguish:
- Integrated resorts, exposed to tourism, premium demand, capex execution, and fixed operating costs.
- PAGCOR-operated venues, tied to government operation and domestic demand.
- Electronic gaming, offering scale but carrying heightened regulatory and quarterly volatility.
- Licensed online products, where opportunity depends on the final licensing framework and enforcement conditions.
Add exposure only when actual GGR releases confirm the scenario assumptions. Trim risk when quarterly declines persist, electronic gaming weakens further, or regulatory restrictions narrow the addressable market. That discipline is more reliable than valuing the sector from 2025's exceptional topline alone.
Methodology, Sources and Quick Answers
This outlook combines PAGCOR's annual and quarterly GGR disclosures with independent forecasts cited in the verified data. The analysis separates licensed casinos, PAGCOR-operated casinos, and electronic gaming before interpreting the broader Philippines casino market size 2026. It doesn't treat total gaming GGR as equivalent to private land-based casino revenue.
The main limitation is definitional. PAGCOR's total includes multiple gaming categories, while no single authoritative online GGR series covers every product and operator consistently. Q1 and Q2 2026 figures also show that annualising one quarter could distort the full-year view.
| Source | Data Type | Use in Outlook |
|---|---|---|
| PAGCOR official disclosures | Quarterly industry and segment GGR | Separates licensed casinos, electronic gaming, and PAGCOR venues |
| PAGCOR H1 2025 release | First-half industry and segment data | Establishes the structural shift toward electronic gaming |
| Business Inquirer 2025 report | Full-year 2025 GGR and revenue mix | Sets the market baseline entering 2026 |
| Inquirer Q2 2026 coverage | Q2 2026 performance | Tests land-based resilience against total-market weakness |
| Independent forecast coverage | 2026 contraction scenario | Provides a downside benchmark |
| PAGCOR forecast report | Official PHP320 billion to PHP350 billion range | Defines the central planning corridor |
Quick answers
What is PAGCOR's 2026 GGR guidance? PAGCOR has forecast a range of PHP320 billion to PHP350 billion. The forecast is reported by Yogonet.
Does that equal the Philippines casino market size? No. It represents broad gaming GGR. Licensed-casino revenue must be isolated from PAGCOR-operated venues and electronic gaming.
What is PAGCOR's role? PAGCOR acts as both regulator and operator, so its disclosures contain both market-wide and government-operated revenue lines.
Where should figures be verified? Analysts should begin with PAGCOR releases, then reconcile against reputable reporting and independent forecasts.
Operators, affiliates, suppliers, regulators, and investors should build a segmented 2026 dashboard now, track each PAGCOR release against the PHP320 billion to PHP350 billion corridor, and review exposure whenever licensed-casino and electronic-gaming trends diverge. That process will produce a more decision-ready view than relying on a single headline market-size number.





Join thousands of gaming professionals receiving the latest iGaming news, regulatory updates, and market insights.
