

In 2025, Philippine e-games generated PHP201.12 billion, representing 50.8% of nationwide gross gaming revenue. In 2026, the market has entered an inflection point, with PAGCOR projecting total industry GGR of PHP320–350 billion for the year while the electronic gaming sector declined 22.4% year on year in Q1.
That combination matters more than either figure alone. E-games remain the Philippines' largest gaming revenue pillar, but the channel is no longer operating under the conditions that produced its 2025 record. Demand remains substantial, yet tighter regulation, higher minimum guaranteed fees, and supplier accreditation requirements are forcing operators to defend revenue with a more disciplined cost structure.
Table of Contents
- The 2026 Philippines E-Games Revenue Picture
- Historical Context From 2024 to 2025
- Revenue Segmentation Across the E-Games Channel
- Regulation and the 2026 PAGCOR Reset
- Operators, Suppliers, and Market Share
- Scenario Forecasts for 2026
- Commercial Implications for Operators, Affiliates, and Investors
- Methodology, Forward Calendar, and FAQs
The 2026 Philippines E-Games Revenue Picture
For this analysis, e-games means PAGCOR's regulated electronic gaming channel, covering e-games, e-bingo, bingo, and poker. It measures digitally delivered activity rather than land-based casino revenue, giving a focused view of regulated online casino, electronic bingo, poker, and related products.
The 2025 baseline was unusually high. Electronic and online gaming produced PHP201.12 billion, up from PHP154.66 billion in 2024, and represented **50.8% of the country's PHP396.14 billion total GGR. Philstar's report on Philippine gaming revenue identifies e-games as the industry's main revenue engine.
The 2026 figures show a sharper adjustment. PAGCOR's full-year expectation puts total industry GGR at PHP320–350 billion, while Q1 electronic gaming revenue reached PHP39.90 billion, down 22.4% year on year. Total Q1 GGR was PHP87.60 billion, compared with PHP104.12 billion in the comparable period. Industry coverage of the PAGCOR Q1 disclosure indicates that the contraction extended beyond e-games, although electronic channels remained the largest component.
The baseline and the break
The useful distinction is between cyclical softness and structural compression. Weak Q1 and Q2 run rates point to near-term demand and operating pressure, while the regulatory reset changes the cost of serving the domestic market. Higher minimum guaranteed fees raise the fixed cost of a license, and supplier accreditation raises compliance requirements across the technology and service chain.
Operators studying the Philippines online casino games market should treat the decline as a mixed event. A cyclical recovery could restore part of the lost volume, but fee increases and supplier rationalisation may permanently remove marginal revenue from the channel. The segment-level result will depend on which operators can absorb those costs without sacrificing activity.
| Metric | Value | Source |
|---|---|---|
| 2024 electronic gaming revenue | PHP154.66 billion | Philstar |
| 2025 electronic gaming revenue | PHP201.12 billion | Philstar |
| 2025 share of total GGR | 50.8% | Philstar |
| Q1 2026 electronic gaming revenue | PHP39.90 billion | GGB Magazine |
| PAGCOR 2026 full-year industry projection | PHP320–350 billion | SoloAzar analysis |
Historical Context From 2024 to 2025
Electronic gaming revenue rose from PHP154.66 billion in 2024 to PHP201.12 billion in 2025, a 30.04% increase. The gain also changed the market's composition. Digital gaming became the largest contributor to national GGR, rather than a smaller supplement to land-based casino revenue.
Several commercial factors supported that shift. Players who had adopted digital payments continued using remote gaming products, while operators broadened online casino, bingo, poker, and betting offerings. The B2B supplier framework expanded the technology and content base available to licensed operators, giving platforms, studios, payment providers, and compliance vendors more routes into the market.
The 2025 outcome therefore combined channel migration with commercial expansion. Electronic products were accessible remotely, scalable across a wider customer base, and supported by a growing supplier network. That combination explains the strength of the annual result, but it also increased the segment's exposure to later changes in licensing costs and compliance requirements.
The late-2025 inflection
The growth pattern shifted after tighter rules arrived in the second half of 2025. PAGCOR subsequently reduced its full-year industry expectation to approximately PHP320–350 billion. The adjustment points to a weaker operating environment, although it does not establish that all lost revenue was structural.
The first-half run rate shows the break clearly. Electronic gaming revenue fell 22.4% year on year to PHP39.90 billion in Q1, then remained broadly stable at PHP39.85 billion in Q2. E-games represented 45.21% of total industry revenue in the second quarter. Those figures indicate that the contraction was already established, while the flat sequential result suggests that the market had reached a lower near-term operating base rather than continuing to fall at the same pace.
Analytical distinction: The contraction shows that the 2025 growth rate was not sustainable under the new regulatory cost base. It does not show that electronic gaming demand has disappeared.
The 2026 decline has two components. The cyclical portion is the weaker activity and revenue run rate visible across the first two quarters. The structural portion comes from higher fixed licensing costs, heavier compliance obligations, and potential supplier rationalisation. The available evidence does not support assigning a precise percentage to either component, but the mechanism is clear: demand remains present, while a larger share of gross revenue is required to cover regulated operating costs.
That distinction matters for operators assessing whether online casinos are legal in the Philippines. Legal access alone does not determine commercial viability. Operators must also test whether expected activity can support the revised fee and compliance burden. The 2025 phase rewarded expansion. The 2026 reset rewards cost control, scale, and the ability to retain productive customer volume.
Revenue Segmentation Across the E-Games Channel
PAGCOR's published electronic gaming category combines several products rather than providing a complete operator-level revenue split. The verified disclosures identify the sector as including e-games, e-bingo, bingo, and poker, but they don't establish reliable percentage shares for online casino, sports betting, esports, sweepstakes, or individual game formats.
That limitation changes how segmentation should be handled. Directional labels can help explain commercial exposure, but precise estimates such as online casino accounting for a particular share of e-games GGR would go beyond the available evidence. The defensible approach is to compare the products by regulatory exposure, monetisation model, and sensitivity to the fee reset.
Product roles inside the channel
Online casino and live dealer products typically sit closest to the core electronic casino proposition. Their commercial economics depend on game content, platform stability, payments, identity controls, and player retention. The live dealer casino games ecosystem illustrates why suppliers serving this area face exposure across several cost lines, from studios and streaming infrastructure to compliance and customer support.
E-bingo and bingo are separate electronic products within PAGCOR's reported sector. Their inclusion in the electronic total shows why the headline category should not be treated as synonymous with online casino alone. Revenue performance can differ across formats because game frequency, player behaviour, distribution, and operating requirements aren't identical.
Poker also remains part of the electronic gaming disclosure. Its peer-to-peer structure creates a different relationship between player liquidity, platform technology, and operator monetisation than a house-banked casino product.
Sports betting, esports wagering, and promotional or sweepstakes-style products may be commercially relevant to operators, but the verified PAGCOR figures provided here don't establish their individual shares of electronic GGR. They should therefore be treated as adjacent exposure areas rather than assigned unsupported market weights.
| Segment | Evidence-based position | Main commercial sensitivity |
|---|---|---|
| E-games and online casino | Included within PAGCOR's electronic gaming category | Platform, content, payments, retention, and regulatory fees |
| E-bingo and bingo | Explicitly included in the reported sector | Product demand and licensing economics |
| Electronic poker | Explicitly included in the reported sector | Liquidity, platform reliability, and compliance |
| Sports betting | Relevant digital gaming activity, but no verified share supplied | Customer acquisition, event cycles, and regulatory treatment |
| Esports and sweepstakes | Emerging adjacent categories, without verified share data | Product permissions, distribution, and compliance |
The practical conclusion is that the electronic channel is diversified by product but not equally exposed by economics. Operators shouldn't infer that every sub-segment will react identically to the 2026 reset. They should map each product to its fee treatment, supplier dependence, and ability to retain players without escalating acquisition spend.
Regulation and the 2026 PAGCOR Reset
PAGCOR's 2026 framework raises the minimum cost of serving the local online market. Its two-tranche Minimum Guaranteed Fee structure applies to Gaming System Administrators, or GSAs, and separates operators with electronic casino games from those without them. A detailed overview is available in the PAGCOR regulatory updates for 2026.
From April 1 to September 30, 2026, GSAs with electronic casino games are scheduled to face a minimum monthly GGR threshold of PHP30 million and a PHP9 million MGF. GSAs without electronic casino games are scheduled to face a PHP15 million threshold and a PHP3 million fee. From October 1, 2026, those figures are scheduled to rise to a PHP35 million threshold and PHP10.5 million MGF for the electronic-casino variant, and a PHP20 million threshold and PHP4 million MGF for the non-electronic-casino variant. The framework is summarised in Arden Consult's analysis of PAGCOR's 2026 regulatory updates.
The fee floor changes the break-even test
| License variant | MGF Tranche 1, effective Q1 2025 | MGF Tranche 2, effective October 1, 2026 | Net-revenue definition |
|---|---|---|---|
| GSA with electronic casino games | PHP30 million monthly threshold, PHP9 million MGF | PHP35 million monthly threshold, PHP10.5 million MGF | Determined by applicable PAGCOR rules and licence terms |
| GSA without electronic casino games | PHP15 million monthly threshold, PHP3 million MGF | PHP20 million threshold, PHP4 million MGF | Determined by applicable PAGCOR rules and licence terms |
The MGF is a fixed economic hurdle. A GSA must assess whether licensed revenue can support the guaranteed fee after taxes, payments, technology, marketing, staffing, responsible gaming, and supplier costs. Gross player activity alone does not answer that question.
The reset creates two distinct contraction risks. The first is cyclical, as weaker player activity can leave otherwise viable GSAs below the applicable monthly threshold. The second is structural, because the scheduled second tranche raises the recurring hurdle even if demand stabilises. Electronic-casino GSAs therefore face the larger absolute exposure, with the scheduled MGF moving from PHP9 million to PHP10.5 million. Non-electronic GSAs face a lower fee base, but their smaller revenue pools may leave less room to absorb fixed costs.
PAGCOR also requires domestic B2B service providers, including game aggregators, studios, payment gateways, KYC providers, affiliates, streaming firms, support providers, and gaming technology vendors, to secure direct accreditation by July 31, 2026. MundoVideo's report on the supplier deadline states that unaccredited suppliers face decommissioning or shutdown of their systems and products from August 1, 2026.
Practical rule: A supplier's commercial value in the Philippines now depends on uninterrupted accreditation, not just game performance or platform functionality.
Operators should audit every white-label technology, payments, KYC, affiliate, and support dependency before the deadline. The verified material does not establish a universal application-document checklist, so audited financials, platform integrations, and responsible gaming records remain diligence areas rather than confirmed requirements for every supplier.
Operators, Suppliers, and Market Share
The Philippine electronic market has three operating layers. At the top sit GSAs and landing-platform operators, which control access to the regulated distribution framework. The middle layer contains B2B game suppliers, platform providers, payment gateways, KYC vendors, studios, affiliates, streaming companies, and support firms. Licensed online casinos form the customer-facing base.
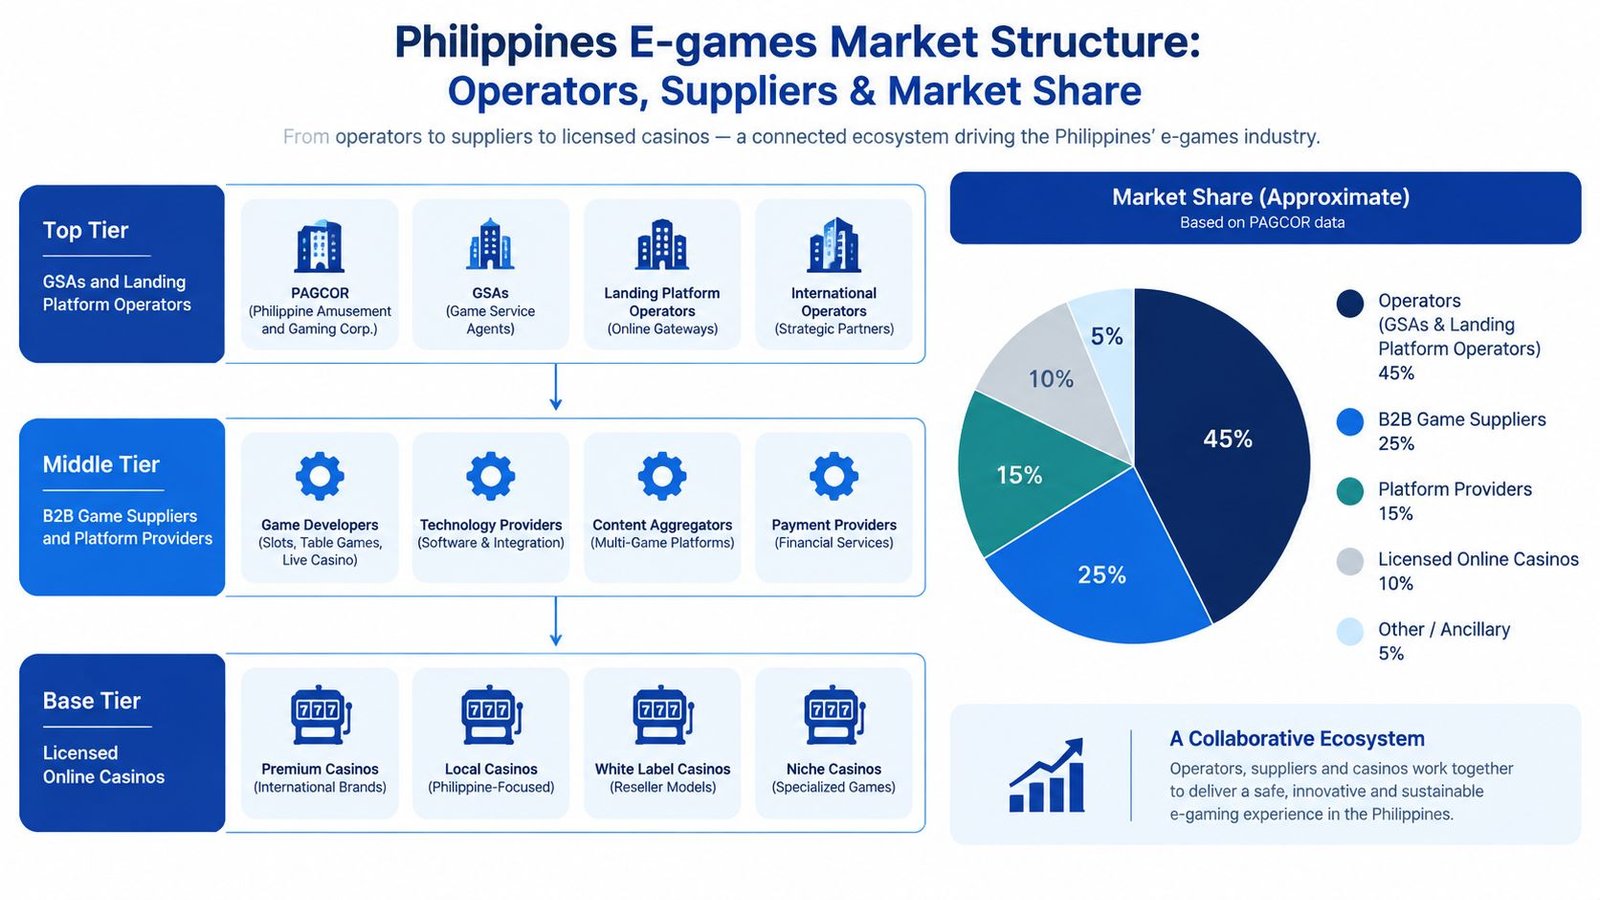
PAGCOR's verified disclosures establish the size of the electronic sector, but they don't provide operator-level GGR splits. As a result, claims about leading operators or exact market share need to remain directional. MGF contributions, licence status, distribution reach, product breadth, and supplier relationships can indicate strategic position, but they aren't substitutes for audited operator-level revenue data.
Who carries the greatest exposure
Large GSAs have the clearest scale advantage, but they also face the largest absolute fee obligations. Their priority is to keep enough productive volume on regulated platforms to cover the MGF while maintaining compliance across a broad operating footprint.
Mid-tier GSAs and landing platforms face a more binary decision. They may have sufficient distribution to remain viable, but a narrower revenue base leaves less room for underperforming products, high acquisition costs, or supplier disruption.
B2B suppliers face a different form of concentration risk. A game studio or aggregator can remain technically valuable while losing access to the domestic channel if it misses the accreditation requirement. The exposure extends beyond games to payments, KYC, affiliate services, live streaming, and operational support.
Licensed online casinos sit at the bottom of the chain but absorb the commercial consequences of every upstream change. If a platform loses a supplier, a payment route, or a content feed, the casino can experience product gaps or customer friction even when its own licence remains valid.
The PAGCOR B2B provider application process should therefore be viewed as a market-access issue, not a routine administrative formality. Operators and investors should build supplier maps that distinguish critical infrastructure from replaceable content. The verified data supports a strong conclusion on timing, but not a definitive ranking of individual companies: the July deadline can accelerate consolidation without revealing in advance which providers will acquire the displaced capacity.
Scenario Forecasts for 2026
The evidence supports a range rather than a single precise e-games forecast. PAGCOR projects full-year industry GGR of approximately PHP320–350 billion, while electronic gaming generated PHP39.90 billion in Q1 and PHP39.85 billion in Q2. The earlier quarterly reporting indicates that the electronic channel remains large, although its growth has reversed.
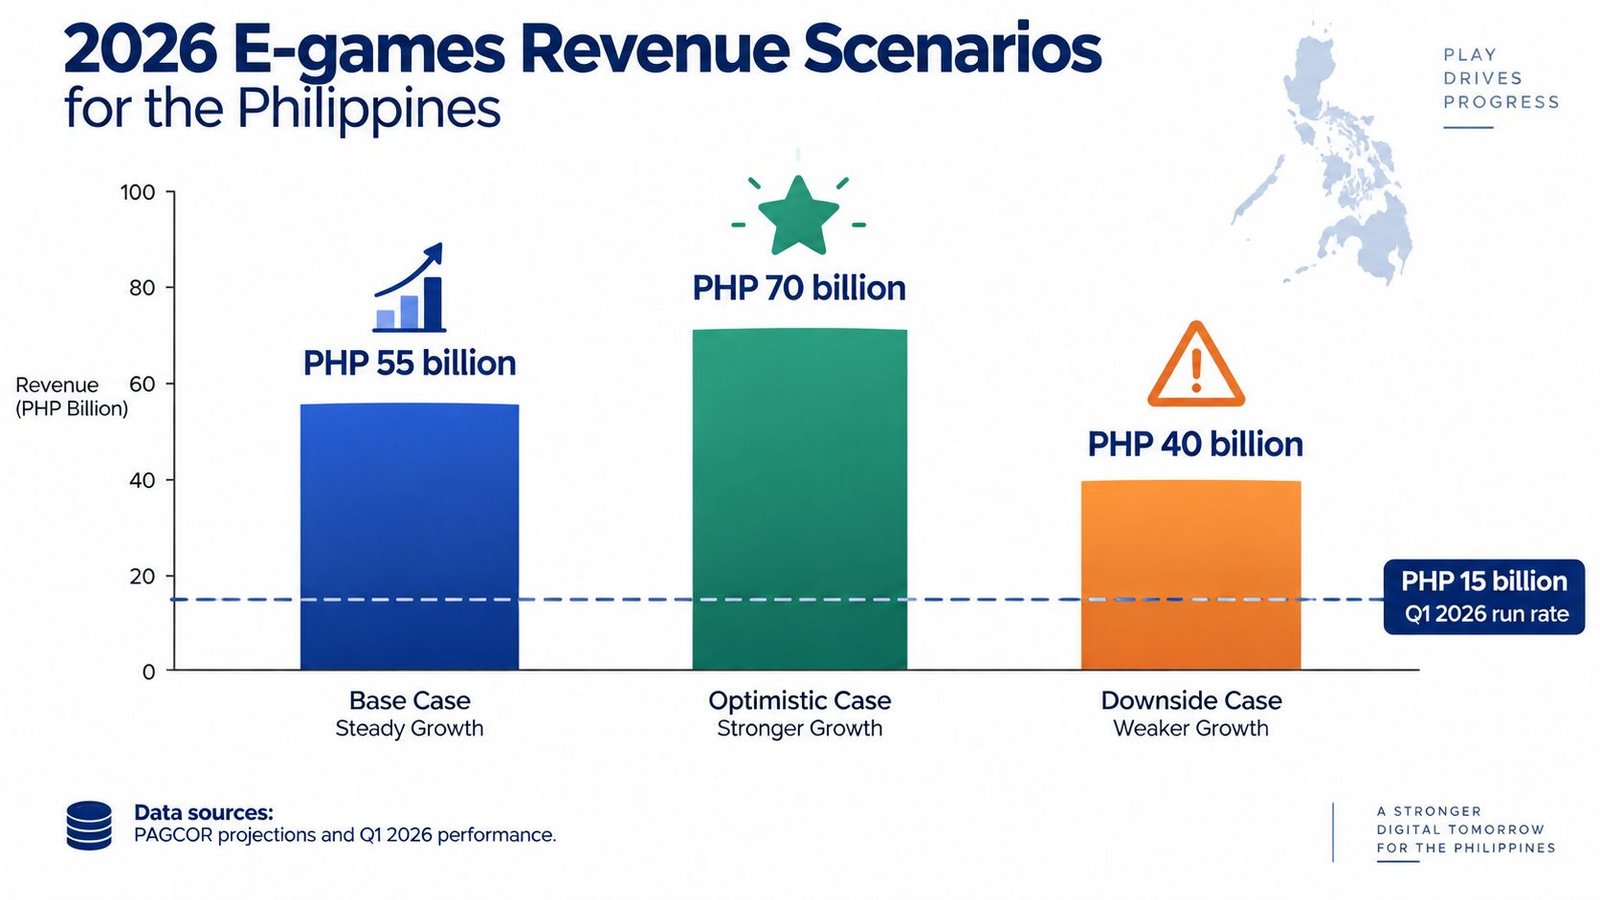
The visual sets out PHP55 billion for the base case, PHP70 billion for the optimistic case, and PHP40 billion for the downside case, with a Q1 run-rate marker of PHP15 billion. These are editorial modelling assumptions, not PAGCOR-reported e-games forecasts. PAGCOR's projection covers total industry GGR, so it should not be treated as an electronic-channel target.
Base case
The base case assumes the October MGF tranche takes effect on schedule, supplier accreditation removes weaker participants from the regulated chain, and Q3 and Q4 settle near the Q2 run rate. Revenue therefore stays structurally large, while economically marginal activity contracts because the cost of serving it rises.
This outcome separates the contraction into two parts. The cyclical component is the weaker activity already visible in the quarterly results. The structural component comes from the MGF reset and accreditation requirements, which reduce the amount of GGR that operators can service profitably. The base case is the clearest central estimate because it includes both effects without assuming a rapid recovery.
Optimistic case
The optimistic case requires regulated demand to hold after the higher fee floor, while operators preserve payment access, content availability, and customer retention. Activity in products sensitive to event cycles or player engagement would also need to recover.
Under those conditions, revenue could approach the higher scenario shown in the visual. That would indicate stabilisation after the reset, not a return to the previous expansion rate. The second MGF tranche would still limit low-yield volume, so improvement would depend more on productive regulated activity than on gross traffic alone.
Downside case
The downside case combines existing revenue weakness with accreditation disruption. Operators could lose suppliers, customers could face fewer products, and some activity could move outside the regulated channel. A sharper decline in bingo-related products would place further pressure on the combined electronic total.
The two-tranche MGF reset makes this scenario segment-sensitive. Products with low yield and high servicing costs face the greatest risk, while operators with stronger retention and compliant supplier coverage have more capacity to absorb the change.
Forecast discipline: The industry projection is a total-market band. Segment scenarios are analytical ranges, not PAGCOR guidance.
The decisive variable is the share of existing electronic GGR that remains serviceable after fees, accreditation requirements, and operating costs.
Commercial Implications for Operators, Affiliates, and Investors
The 2026 reset changes what counts as a strong market position. A large player base still matters, but volume without fee coverage can weaken an operator's economics. The decisive advantage shifts toward businesses that can retain regulated users, control technology dependencies, and maintain compliant access through the supplier deadline.
Operators
Operators should start with a product-level profitability review. Electronic casino products face the higher MGF variant, so management teams need to test whether each channel can support its fixed regulatory burden after payments, content, customer support, promotions, and technology costs.
The priority list is clear:
- Protect regulated retention: CRM, reliable payments, and consistent game availability matter more when acquisition becomes expensive.
- Reduce dependency risk: Critical KYC, payments, platform, studio, and support suppliers should have verified accreditation plans.
- Separate scale from productivity: Gross activity isn't enough if a product fails to contribute toward the applicable guaranteed fee.
- Control promotional leakage: Bonus and acquisition programmes should be assessed against contribution after regulatory and supplier costs.
A vertically integrated operator may withstand the reset better than a heavily white-labelled competitor, but integration only helps if it produces compliant, reliable service. Technology ownership without strong governance doesn't solve the market-access problem.
Affiliates
Affiliates face a narrower commercial funnel. Operators under margin pressure may reduce acquisition payouts, scrutinise traffic quality more closely, and demand stronger evidence that campaigns target permitted audiences.
The durable approach is to prioritise licensed operator relationships, transparent terms, responsible gaming controls, and content that helps users understand product and regulatory distinctions. Affiliates that depend on aggressive bonus messaging or unclear operator identities face greater compliance risk as suppliers and platforms become more accountable.
Investors
Investors should underwrite the segment to a conservative scenario rather than assume that PAGCOR's PHP350 billion upper industry projection will translate proportionally into e-games revenue. The verified Q1 decline, followed by a similar Q2 electronic revenue figure, provides a stronger near-term signal than the 2025 growth rate.
The likely capital-allocation winners are businesses with recurring B2B demand, accreditation readiness, diversified operator exposure, and limited dependence on a single white-label chain. Marginal suppliers may exit or consolidate before the deadline, but the verified data doesn't identify specific targets or quantify future transaction activity.
Investment test: The strongest Philippine e-games asset isn't necessarily the operator with the most traffic. It is the one that can convert regulated demand into revenue after the new fixed-cost and compliance structure.
Methodology, Forward Calendar, and FAQs
This analysis uses PAGCOR industry GGR disclosures and the verified 2025 electronic gaming baseline. Core inputs are PHP201.12 billion in 2025 e-games revenue, a 50.8% share of total industry GGR, Q1 2026 electronic revenue of PHP39.90 billion, Q2 revenue of PHP39.85 billion, and PAGCOR's full-year industry projection of PHP320–350 billion. The regulatory assessment uses the published MGF and supplier-accreditation details discussed earlier.
The supplied data does not verify an H1 2026 e-games total of PHP148.49 billion. It also provides no citable findings from Eilers & Krejcik, H2 Gambling Capital, or operator disclosures, so those figures are excluded. Operator-level market-share claims are excluded as well because PAGCOR has not disclosed a complete operator GGR split.
Forward calendar
- July 31, 2026: B2B providers serving the domestic online gaming chain must secure direct accreditation.
- August 1, 2026: Unaccredited suppliers face decommissioning or shutdown of their systems and products.
- September 30, 2026: The first MGF tranche period ends.
- October 1, 2026: The second MGF tranche begins.
- Q3 and Q4 disclosures: These releases will indicate whether the Q1 and Q2 weakness stabilises or continues through the second half of the year.
The calendar creates two separate tests. The July and August requirements test market access and supplier continuity. The October change tests whether operators can absorb a higher fixed-cost floor without reducing activity or supplier spend.
FAQs
What counts as e-games in this analysis?
The category follows PAGCOR's electronic gaming disclosure and includes e-games, e-bingo, bingo, and poker. Land-based casino revenue is excluded from the electronic channel total.
How does the MGF affect operator economics?
The MGF establishes a fixed monthly fee floor for GSAs. Operators must generate enough qualifying activity to cover that obligation, along with taxes, payments, technology, content, marketing, and compliance costs. The higher October tranche therefore raises the break-even hurdle and can pressure weaker segments first.
Is the 2026 contraction structural or cyclical?
It is both. Q1 and Q2 indicate cyclical run-rate weakness. The MGF reset and supplier-accreditation framework add structural pressure through higher operating costs and tighter market access. The available data cannot assign the full contraction to either factor, but the October step-up makes the structural portion more likely to persist beyond a temporary revenue dip.
How does PAGCOR's PHP320–350 billion band compare with e-games forecasts?
PAGCOR's band covers total Philippine industry GGR, not e-games alone. The scenario model places electronic revenue at PHP40 billion in the downside case, PHP55 billion in the base case, and PHP70 billion in the optimistic case. These are editorial scenarios, not official PAGCOR segment forecasts.
Operators, suppliers, affiliates, and investors should compare upcoming PAGCOR disclosures with the Q1 and Q2 electronic run rates, confirm supplier accreditation before the July deadline, and stress-test Philippine revenue models against the October MGF step-up.





Join thousands of gaming professionals receiving the latest iGaming news, regulatory updates, and market insights.
