


Higher gambling revenue doesn't necessarily mean more customers. In Great Britain, online gross gambling yield rose 8% while average monthly active accounts fell 7% during July to September 2025, according to the Gambling Commission's operator-data announcement. That divergence changes how an iGaming market should be valued: customer acquisition, betting activity and operator revenue aren't interchangeable measures of growth.
A useful market assessment starts with size, then asks what produced that value and how much demand remains outside licensed channels. For operators, suppliers and investors, the commercially relevant question isn't whether online gambling is expanding. It's whether expansion can support sustainable margins, defensible customer protection and realistic regulatory assumptions.
Table of Contents
- Global and Regional iGaming Market Size
- What Gross Gambling Yield Actually Measures
- Reading Slots Betting and Account Signals
- Why Licensing Does Not Equal Channelisation
- Where Operators Actually Compete
- Growth Forecasts and Scenario Building
- Decide Where to Allocate the Next Dollar
Global and Regional iGaming Market Size
The global online gambling market generated USD 87.7192 billion in revenue in 2025, according to Grand View Research's global online gambling outlook. That provides a headline estimate, but it isn't a substitute for jurisdiction-level accounts.
The following rows cannot be summed. They use different currencies, reporting periods, revenue definitions and coverage boundaries. Some describe the entire commercial gaming industry; others describe online gambling, regulated online casino or association members.
iGaming market size benchmarks
| Market | Measure | Period | Value | Change |
|---|---|---|---|---|
| Global online gambling | Revenue | 2025 | USD 87.7192 billion | Annual change not stated |
| US commercial gaming | GGR | 2025 | USD 78.72 billion | +9.2% year over year |
| US regulated iGaming | Revenue | 2025 | USD 10.74 billion | +27.6% year over year |
| US iGaming taxes | Tax | 2025 | USD 2.59 billion | +36.9% year over year |
| Great Britain online | GGY | Year to March 2025 | £7.8 billion | More than £900 million higher |
| Great Britain industry total | GGY | Year to March 2025 | £16.8 billion | +7.3% year over year |
| EGBA members online | GGR | 2024 | €13.5 billion | +15% year over year |
The US entries come from the American Gaming Association's commercial gaming revenue release, which reports USD 78.72 billion in commercial gaming GGR, USD 10.74 billion in regulated iGaming revenue and USD 2.59 billion in iGaming taxes for 2025, with respective annual increases of 9.2%, 27.6% and 36.9%. The British entries follow the Gambling Commission's industry statistics commentary, reporting £7.8 billion in online GGY, more than £900 million higher, and £16.8 billion across the industry, up 7.3%, in the year to March 2025. The European Gaming and Betting Association's annual activity report puts its members' combined online GGR at €13.5 billion in 2024, up 15%.
What the regional differences mean
United States. Regulated online casino grew faster than the wider commercial gaming sector. The analytical implication is digital expansion within an established gambling economy, not equivalent growth across every gambling product or state. The tax figures also explain why state-level fiscal design belongs in commercial due diligence rather than in a separate legal appendix.
Tax receipts aren't operator earnings. A jurisdiction can generate attractive public revenue while leaving operators with a less attractive contribution margin after gaming duties, promotions, platform costs and customer acquisition. Investors should therefore model the operator's economics separately from the government's receipts.
Great Britain. Online activity represented roughly 46% of reported industry GGY, according to the same Gambling Commission industry commentary cited for the British table entries. This makes Britain a useful mature-market benchmark for remote gambling, but not a universal template for markets with different product permissions, payment infrastructure or consumer behaviour.
Europe. The EGBA measure is a member-company total, not a census of European online gambling. Treating it as the continent's complete market size would confuse an association reporting boundary with a geographical one. It remains useful for understanding the scale and direction of that particular operator group.
Comparison rule: A market-size figure is useful only after its reporting boundary has been matched to the business being valued.
The same discipline applies outside these benchmarks. An assessment of Philippine market entry, for example, should examine PAGCOR payment gateway accreditation alongside the commercial model rather than assume payment access follows automatically from gambling demand.
Before comparing growth, analysts should identify the exact jurisdiction, permitted products and addressable customers behind each row. Currency conversion can make figures look comparable on a spreadsheet. It cannot reconcile different regulatory perimeters or turn member-company revenue into a national total.
What Gross Gambling Yield Actually Measures
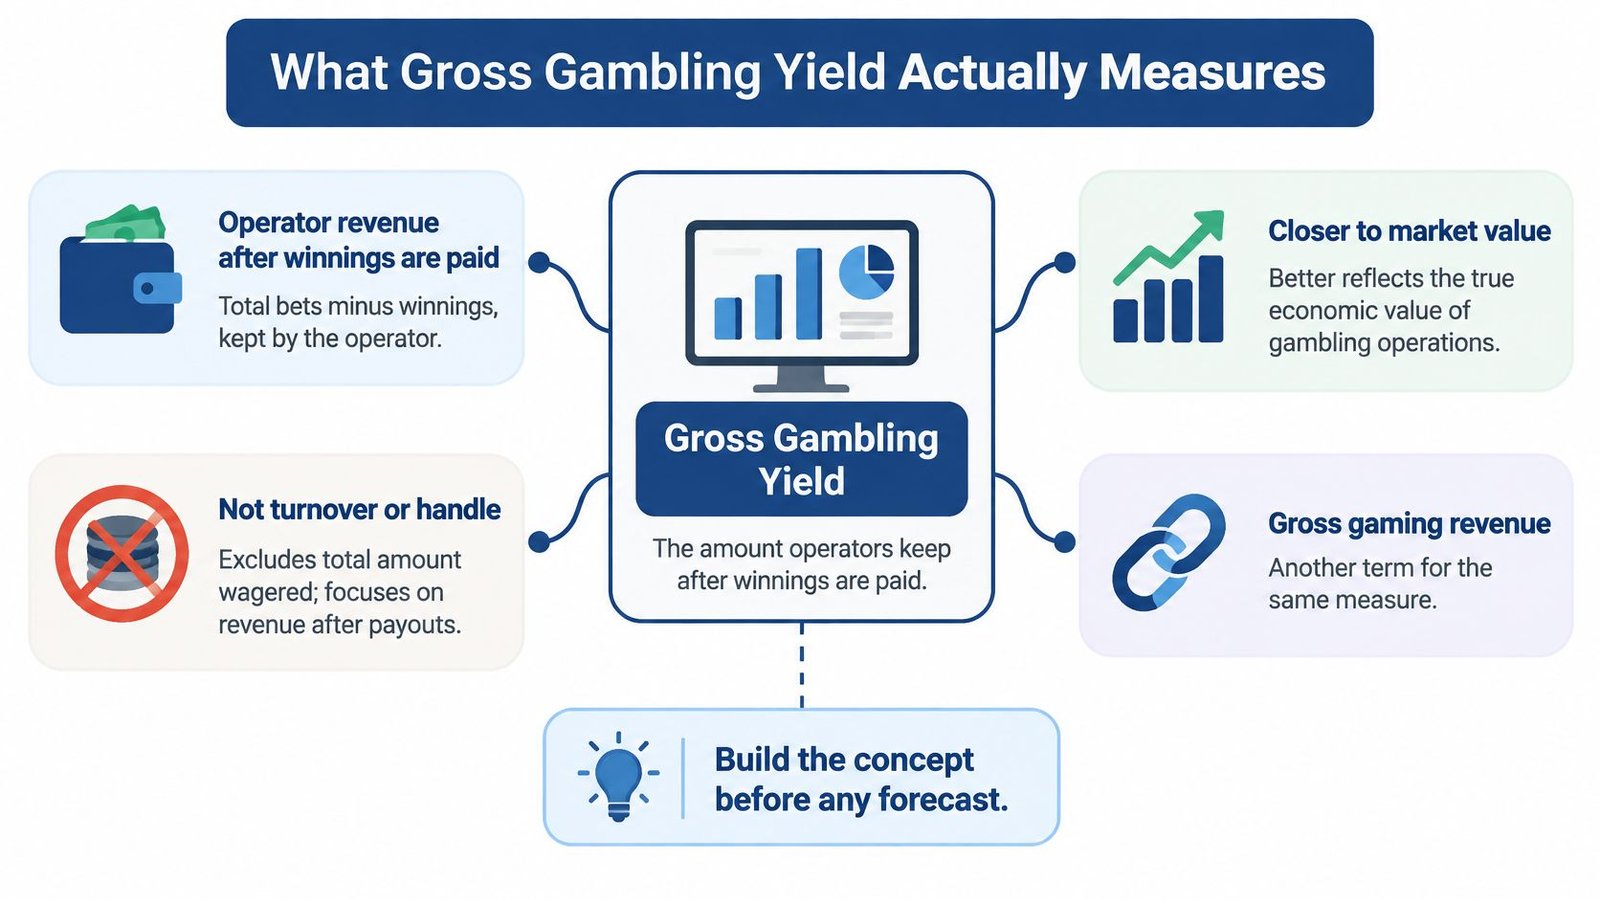
Gross gambling yield, or GGY, measures operator revenue after winnings are paid. The Gambling Commission's market overview to December 2024, published February 2025 provides the operator-series context for interpreting this measure. Turnover or handle measures wagering activity, not the revenue retained from it.
A shop analogy helps establish the distinction. GGY resembles takings after customer refunds, while handle resembles the queue at the till: a longer queue doesn't guarantee a larger retained amount if the economics of each transaction deteriorate. The analogy stops before profit, because gambling operators still have taxes, supplier charges, staffing and other expenses to pay.
Revenue labels require a definition check
Gross gaming revenue, or GGR, is the related term used in US commercial reporting. Analysts shouldn't assume that every publisher applies GGR and GGY identically, particularly when assessing promotional deductions, reporting adjustments or product classifications.
A reliable model preserves the original source label and adds a definition field. If different series require reconciliation, the adjustment should be explicit rather than concealed inside a combined revenue column.
The working market breakdown also matters:
- Online slots: A high-frequency gaming vertical that should have its own activity, account and revenue measures.
- Real-event betting: Wagering tied to actual sporting events, where the event calendar and sporting outcomes affect interpretation.
- Other online casino and live casino: Separate gaming products that shouldn't automatically be counted as slots because they appear inside the same casino application.
UEFA Euro 2024 illustrates why the sporting calendar belongs in the analysis: the Gambling Commission's operator overview cited above identifies the tournament as a contributor to betting demand. A tournament-related increase shouldn't be projected into an ordinary sporting period without an adjustment.
A growth rate needs a reporting boundary
The same source describes an operator dataset tracking online gambling from March 2020 onward. That history supports comparisons between pandemic-era activity and subsequent trading, but the start date alone doesn't establish a perfectly consistent series.
Analysts should check whether participating operators, reporting practices or category definitions changed. They should also distinguish a quarterly movement from a comparison against the corresponding period of the previous year.
A practical reporting record should contain:
- Series identity: The regulator's exact publication title and release date.
- Product scope: Slots, real-event betting, other casino or the combined online total.
- Coverage: The participating operator group and any stated share of the wider market.
- Comparison basis: The measured period and the period against which growth is calculated.
A single iGaming growth rate can hide different product economics. Promotions may increase activity without producing equivalent retained revenue, while sporting results can change betting yield without a matching change in customers. The defensible rule is to attach vertical, period and coverage to every growth claim before using it in a forecast.
Reading Slots Betting and Account Signals
Great Britain's quarterly operator releases provide a worked example of why revenue, transactions and accounts must be read together. They aren't complete market censuses, and their coverage statements shouldn't be treated as permanent properties of the series.
For the later operator sample, the Gambling Commission's market overview to September 2025, published November 2025 covers approximately 70% of the online market and reports July to September 2025 online GGY of £1.42 billion, up 8%, including £747 million from slots and £508 million from real-event betting.
Great Britain online GGY by quarter
| Quarter | Online GGY | Year-over-year | Slots GGY | Real-event betting GGY | Activity note |
|---|---|---|---|---|---|
| Apr-Jun 2024 | £1.46 billion | +12% | £642 million | £625 million | 24.5 billion bets and spins, +11% |
| Oct-Dec 2024 | £1.54 billion | +21% | £709 million | £647 million | Real-event GGY highest since Q2 2021 |
| Jul-Sep 2025 | £1.42 billion | +8% | £747 million | £508 million | 26.1 billion bets and spins, +3%; accounts -7% |
| Oct-Dec 2025 | £1.5 billion | -2% | £788 million | £530 million | 27.4 billion bets and spins, +6% |
The April to June figures in the table are reported in the Gambling Commission's market overview to June 2024, published July 2024: £1.46 billion in online GGY, up 12%, with £642 million from slots, £625 million from real-event betting and approximately 24.5 billion bets and spins, up 11%. This is a case where revenue and activity expanded together.
For October to December 2024, the Gambling Commission industry-statistics publication records £1.54 billion in online GGY, up 21%, with slots at £709 million and real-event betting at £647 million, the latter's highest level since the second quarter of 2021; its stated operator coverage is approximately 80%. The different coverage statement is a reason to check methodology before treating the rows as a like-for-like market census.
The account denominator changes the interpretation
The September 2025 overview cited above also reports 26.1 billion bets and spins, up 3%, average monthly active accounts of 12 million, down 7%, and average monthly active slots accounts of 4.4 million. These are accounts, not necessarily unique individuals.
That combination supports an interpretation of greater revenue intensity rather than straightforward customer-base expansion. It doesn't establish whether the cause was better product performance, a different customer mix, sporting outcomes or more intensive gambling by retained customers.
The warning becomes clearer in the Gambling Commission's market overview to December 2025, published February 2026: online GGY fell 2% to £1.5 billion despite a record 27.4 billion bets and spins, up 6%, as real-event betting GGY fell 18% to £530 million while slots rose 10% to £788 million. Dividing that slots figure by the reported online total gives approximately 53%, an analytical calculation rather than a separate regulator market-share total.
More transactions can coexist with less revenue. Activity is a denominator, not a valuation.
Forecasting teams should therefore model GGY per bet or spin, GGY per active account and contribution margin by vertical. Missing observations should remain marked unknown rather than be estimated merely to complete a table. Where slots intensity increases, commercial and safer-gambling teams should jointly test whether the apparent improvement reflects product quality or a greater concentration of losses.
Why Licensing Does Not Equal Channelisation
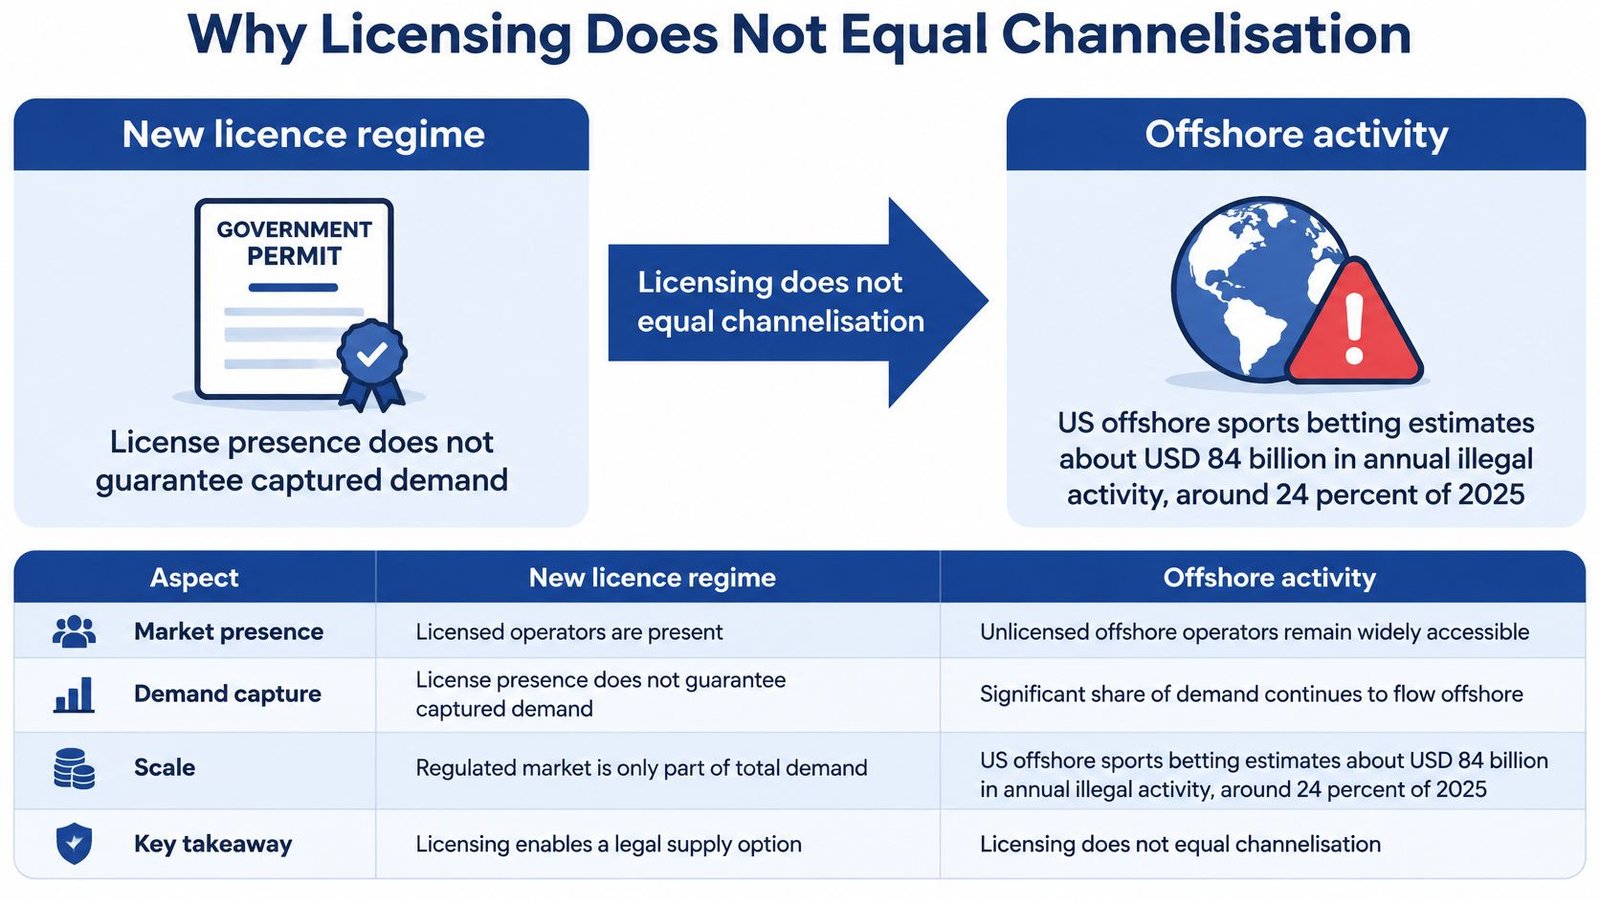
Reporting by LCB on US offshore gambling demand estimates approximately USD 84 billion in annual illegal US sports-betting activity, representing around 24% of 2025 sports-betting handle. This is a reported estimate of wagering activity, not an official regulator revenue total.
The distinction matters because an expanding licensed market can coexist with substantial offshore demand. Issuing licences establishes a legal supply framework. It doesn't prove that customers have abandoned unlicensed alternatives.
What moves demand onshore
Channelisation describes the share of gambling demand captured by licensed products. Any published channelisation percentage needs its own denominator: player participation, spending, handle and revenue don't answer the same question.
A market assessment should test the interaction between the following levers rather than assume a universal policy formula:
- Tax design: Whether operators can fund a competitive licensed offer after duties and compliance costs.
- Product availability: Whether authorised products cover the gambling experiences customers seek.
- Payment access: Whether legitimate customers can deposit and withdraw through reliable, permitted channels.
- Advertising rules: Whether customers can identify licensed alternatives without undermining consumer safeguards.
- Consumer protection: Whether verification, complaints procedures, exclusion tools and withdrawal processes support a credible legal proposition.
These levers create trade-offs, not automatic outcomes. A restrictive product catalogue might strengthen a particular policy objective while leaving some demand unserved. Easier payment access might improve legal-market participation while increasing the importance of transaction monitoring.
Compliance success and demand capture are different tests
The analytical warning is that tax and product design can preserve offshore demand if licensed alternatives become materially less attractive. That isn't a measured tax elasticity, and it doesn't establish that any particular tax reduction would produce a specified migration of customers.
The LCB reporting also describes pressure on banks, payment firms, software suppliers and media businesses, extending enforcement beyond gambling operators. Such measures should be assessed through their effect on customer access and behaviour, not just by counting enforcement announcements.
For jurisdiction monitoring, PAGCOR regulatory updates provide a relevant policy-tracking reference. Commercial models should still verify operative rules against official documents before treating an update as an implementation assumption.
A credible evidence file combines legal-market share estimates, offshore-brand search demand, payment-decline patterns, enforcement outcomes and differences in odds or return-to-player settings. Each measure has weaknesses: searches don't prove deposits, payment declines don't prove migration, and enforcement actions don't establish sustained demand reduction.
Underwriting question: Does the forecast contain evidence that customers will switch to licensed products, or only an assumption that they should?
The strongest analysis triangulates these indicators and states what remains unobserved. A licence count can describe market access. Only evidence about customer behaviour can establish how much demand that access captures.
Where Operators Actually Compete
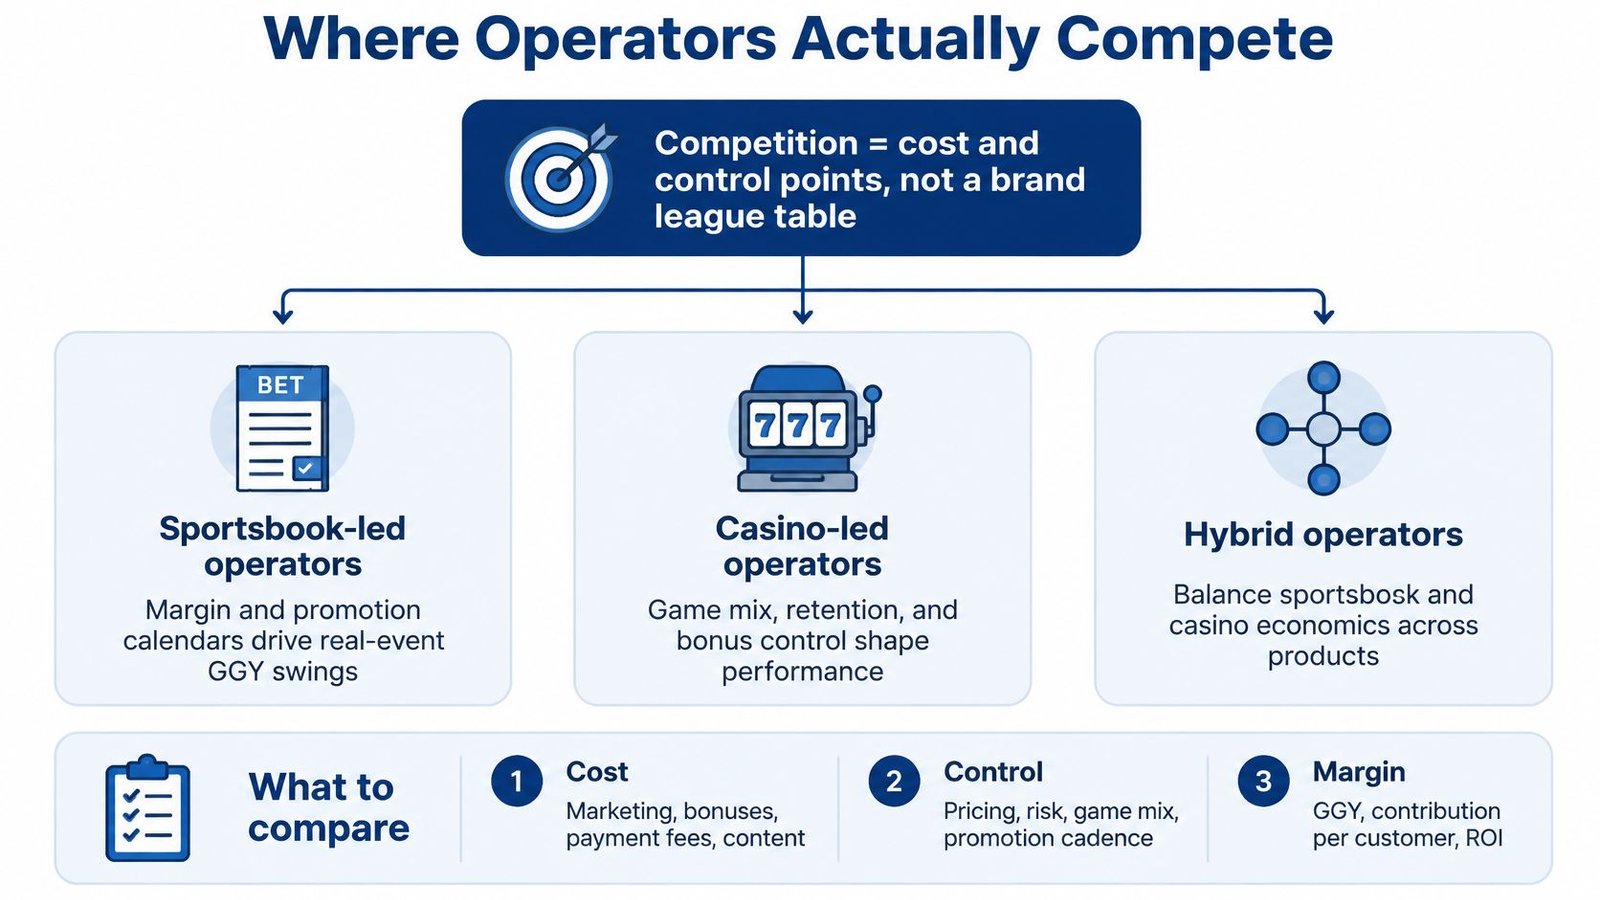
An operator comparison becomes more useful when it separates cost and control points from brand visibility. A sportsbook-led business, a casino-led business and a multi-vertical group may report similar headline growth while taking different risks to achieve it.
For a sportsbook-led operator, the analytical focus should be pricing, event exposure, promotional spending and retained margin. For a casino-led operator, the comparable questions concern game mix, bonus control, session design and retention. A multi-vertical group also needs to demonstrate that shared infrastructure produces savings rather than conceals weak product economics.
Supplier economics belong in the comparison
Live casino providers, platform vendors, payment processors, identity-verification services and game aggregators sit inside the operating cost stack. Analysts should examine contractual minimums, integration costs, revenue-sharing arrangements and the operator's ability to replace a supplier.
Regulatory access can also constrain procurement. An assessment involving Philippine distribution can incorporate PAGCOR game aggregator accreditation requirements into supplier diligence without assuming that a commercially attractive catalogue is automatically deployable.
Competitive monitoring should capture publicly available product ranges, promotions and terms in a consistent format. Scrappey's guidance to boost data collection for competitive intelligence offers a practical reference for that workflow; collection should respect applicable law, access restrictions and privacy obligations.
AI requires a narrower investment case
Blask's analysis of AI in iGaming describes deployment as most concentrated in customer support, with more limited adoption across dynamic odds, risk management, onboarding, payments, acquisition, regulatory reporting and live casino. It also identifies limited public disclosure of intervention accuracy, false positives and long-term harm-reduction outcomes.
The comparison below is therefore a qualitative evidence assessment, not a ranking of proven vendor returns.
| AI use | Public deployment evidence | Business case to test | Main risk |
|---|---|---|---|
| Generative customer service | Widest public use | Lower handling cost | Inaccurate answers to players |
| Fraud and KYC automation | Limited public detail | Fewer fraud losses and faster checks | False declines |
| Predictive risk and dynamic odds | Thin public detail | Margin protection | Model error and regulatory scrutiny |
| Pricing algorithms | Thin public detail | Hold and margin control | Unfair pricing complaints |
| Safer-gambling interventions | Thin public detail; accuracy rarely disclosed | Avoided harm and defensible controls | False positives and privacy exposure |
An AI procurement decision shouldn't begin with an assumed revenue uplift. It should begin with a measurable operating problem, an agreed baseline and a test that can distinguish model performance from changes in customer mix or trading conditions.
For safer-gambling tools, procurement teams should request intervention accuracy, false-positive rates, escalation procedures and evidence about customer outcomes. Retention effects matter commercially, but retaining an at-risk customer isn't an adequate definition of success.
Avoided losses, faster investigations and auditable controls may offer a more defensible investment case than automated revenue optimisation. Any system acting on player behaviour also needs documented data access, human oversight and clear accountability for decisions.
Growth Forecasts and Scenario Building
A market forecast shouldn't acquire credibility merely because it contains a compound annual growth rate. The global market estimate establishes a historical base, but the cited evidence doesn't establish a forward global growth figure that can be verified here.
Any forward rate should therefore be labelled a scenario assumption, not attributed to the historical market-size publisher. A useful forecast exposes its assumptions rather than compressing them into an apparently authoritative percentage.
Build from operating drivers
The working revenue identity is active accounts × activity per account × revenue yield per activity, applied separately to each vertical. The periods and units must align: monthly average accounts cannot be multiplied by quarterly activity per account without a consistent treatment.
The British quarterly evidence provides stress patterns rather than a ready-made forecast. A model should permit revenue growth without account growth, and activity growth without revenue growth. Otherwise, its structure rules out outcomes that operating evidence already demonstrates.
| Scenario | Commercial assumption | Tax assumption | Payment access | Product approval |
|---|---|---|---|---|
| Base case | Retained customers and ordinary product development support trading | Existing treatment continues | Current permitted channels remain available | Only authorised products included |
| Slots-led case | Game mix and engagement shift toward slots | No unverified tax relief assumed | Processing supports the changed transaction mix | Necessary approvals precede deployment |
| Regulatory-shock case | Compliance friction or product restrictions reduce contribution | Higher burden tested explicitly | More payment interruptions or checks | Launches delayed or catalogue restricted |
These scenarios should produce different contribution outcomes, not just different gross revenue lines. A slots-led case, for example, needs matching assumptions for supplier charges, promotions, customer-risk monitoring and support capacity.
Offshore demand is a sensitivity, not booked revenue
The reported US offshore activity estimate can inform a sensitivity test, but it cannot be added directly to regulated revenue. Handle must first be distinguished from retained revenue, and any assumed migration must account for product availability, customer eligibility and the attractiveness of licensed alternatives.
The appropriate sensitivity varies the capturable share of offshore demand, rather than treating the entire estimated pool as future business. Uncertain enforcement effects should remain uncertain inputs.
Product launch timing deserves similar treatment. A supplier assessing PAGCOR game content provider accreditation requirements should model approval dependencies rather than book commercial availability before the required permissions exist.
Before approval, every forecast input should pass a compact audit:
- Revenue definition: GGY, GGR, handle or net revenue is identified.
- Coverage: The source population and unobserved market share are stated.
- Currency and period: Conversion and reporting windows are consistent.
- Source date: Publication timing and subsequent revisions are recorded.
- Assumption status: Historical observations remain distinguishable from projections.
A forecast built this way may look less precise than a single headline CAGR. It is more useful because decision-makers can see exactly which assumptions would need to change.
Decide Where to Allocate the Next Dollar
The next investment decision should follow the constraint inside the business, not the largest regional growth headline. The quarterly evidence supports a cautious approach to acquisition-led expansion: a larger account file isn't sufficient proof of better economics, and greater customer intensity isn't automatically a healthy substitute.
Allocation should connect commercial performance with customer protection and regulatory feasibility. Otherwise, a business can optimise a visible metric while weakening the conditions needed to sustain it.
Operators should fund durable value before volume
Retention, game-portfolio quality and responsible-play controls deserve evaluation before an acquisition budget increases. That doesn't mean retention is always the highest-return project. It means the operator should establish why existing customers leave, which products generate contribution and where harmful intensity may be concentrated before purchasing more traffic.
The acquisition decision should combine user acquisition cost with post-bonus contribution, withdrawal experience, fraud exposure and customer-risk outcomes. Campaigns that create registrations without durable, compliant activity shouldn't be treated as successful merely because the cost per registration looks attractive.
Affordability and intervention systems should also be tested against the planned product mix. Commercial teams need evidence that their growth case doesn't depend on unchecked increases in loss concentration.
Investors should underwrite the revenue mechanism
An investment committee should require a clear answer to three questions: What revenue definition is being forecast? What operating driver produces the increase? What demand remains outside the licensed perimeter? Missing answers should affect valuation confidence, not disappear into a general market-risk paragraph.
Regional growth rates shouldn't be transplanted into another jurisdiction's model. Product permissions, customer eligibility, supplier economics and reporting coverage need their own assessment.
For regulators and suppliers, the allocation decision is different but related. Payment access and tax design should be evaluated as parts of the licensed customer proposition, while suppliers should fund integrations and approvals according to realistic deployment opportunities rather than headline addressable-market estimates.
A large theoretical market isn't the same as accessible demand, and accessible demand isn't the same as profitable, responsible revenue.
Turn intelligence into a budget decision
Ongoing monitoring can combine regulator publications, company filings, industry-association reports and Top 1 Rank's market intelligence coverage for jurisdiction, operator and compliance developments. Publication coverage is a discovery tool, not a replacement for the underlying regulatory document or financial statement.
The practical next step is a jurisdiction-specific investment file. Its owner should reconcile market size, vertical mix, account activity, supplier costs and the evidence for offshore demand, then document each coverage gap before committing capital.
Operators, investors and suppliers should select a single jurisdiction and complete that file from primary filings and official datasets before approving the next budget. The resulting decision should identify the funded initiative, the operating constraint it addresses, the customer-protection safeguards and the evidence that would justify continuing or stopping the investment.





Join thousands of gaming professionals receiving the latest iGaming news, regulatory updates, and market insights.
