

In the first quarter of 2026, the Philippines gambling industry generated PHP 87.60 billion in gross gaming revenue, down 15.87% year on year, while licensed casinos supplied 50.83% of total GGR. That makes 2026 a correction year, not a continuation of the online-led expansion recorded in 2025.
The shift matters because the market has moved from record growth to channel rebalancing. Electronic gaming remains commercially important, but its contraction has returned licensed, land-based casinos to the role of primary market anchor. For operators, suppliers, regulators, affiliates, and investors, the central question isn't how large the Philippine gambling market is. It's whether future growth can survive tighter rules, weaker electronic activity, and increasing dependence on licensed casino assets.
Table of Contents
- Philippines Gambling Market at a Glance in 2026
- How the Market Reached This Point From 2024 to 2025
- Segment Breakdown by Channel and Product
- Regulatory Shifts and Taxation Effects Shaping 2026
- Player Demographics Payments and Monetization Metrics
- Growth Drivers Forecasts and Risks Through 2026
- Methodology Sources and What to Watch Next
Philippines Gambling Market at a Glance in 2026
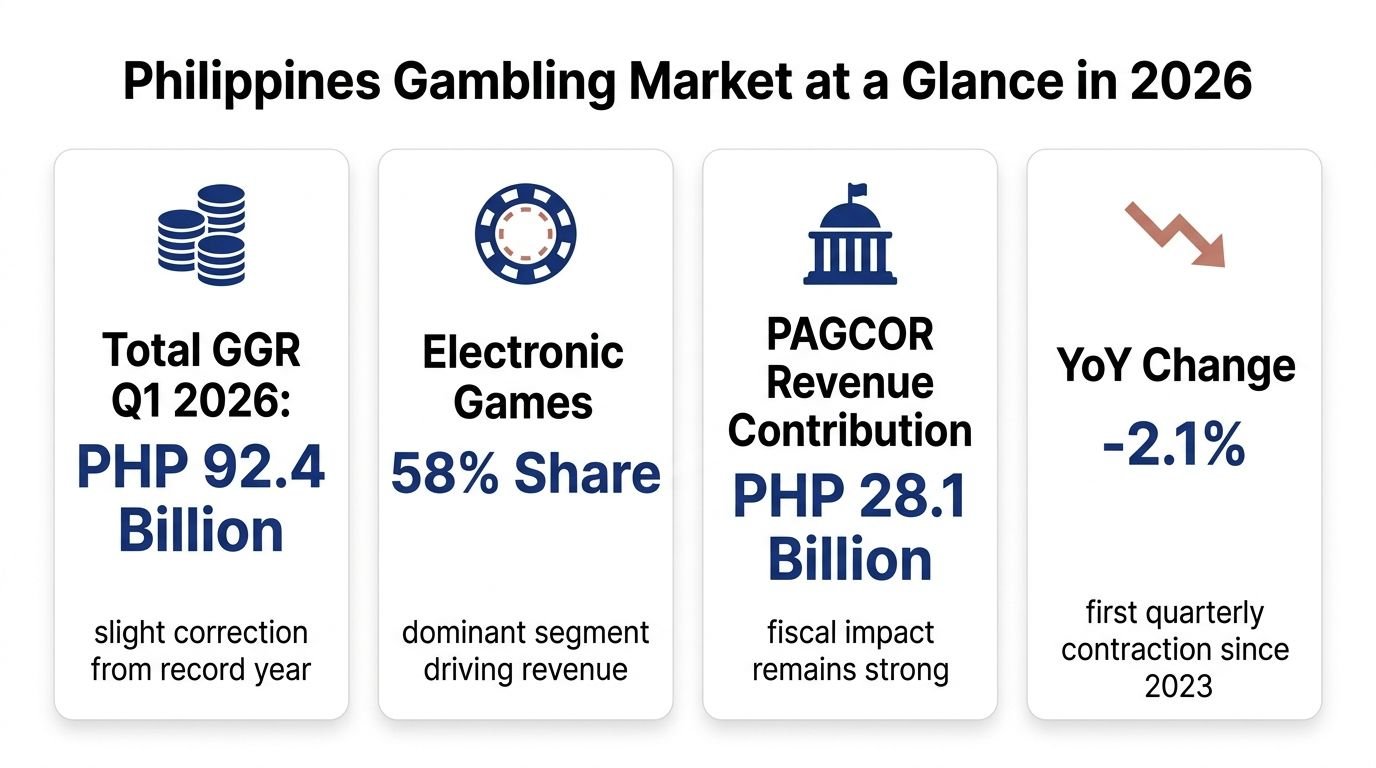
In Q1 2026, total Philippine gross gaming revenue reached PHP 87.60 billion, down from PHP 104.12 billion in Q1 2025, a year-on-year decline of 15.87%, according to PAGCOR's official disclosures. The result keeps gambling nationally significant while showing that 2026 is an inflection point, not a straightforward continuation of the prior expansion cycle.
Licensed casinos generated PHP 44.52 billion, equal to 50.83% of industry GGR during the quarter. Their return to majority share indicates that regulated casino assets have re-anchored the market after electronic gaming weakened. That shift affects how operators, suppliers, and investors should assess stability: exposure to licensed venues now matters as much as headline market size.
The immediate market signal
Electronic gaming, including e-games, e-bingo, bingo, and poker, produced PHP 39.90 billion in Q1 2026, down 22.4% year on year, according to the PAGCOR market disclosure. Its quarterly revenue remained close to the licensed-casino total, but the sharper decline identifies electronic activity as the main source of market pressure.
The implication is selective rather than uniformly negative. Electronic operators and technology suppliers face greater exposure to regulatory tightening and weaker channel momentum. Casino resorts, property-linked entertainment businesses, and vendors serving licensed venues may be better positioned as demand re-centres on regulated physical operations.
Investment reading: The 2026 baseline supports selective expansion, not broad market optimism. Channel exposure matters more than total market size.
Businesses targeting Philippine customers should separate licensed domestic activity from the wider online ecosystem. Licensing status, payment controls, compliance, and responsible-gaming systems now shape commercial durability alongside product selection. The PAGCOR online casino framework offers a practical reference for assessing those requirements before treating electronic GGR as immediately addressable demand.
How the Market Reached This Point From 2024 to 2025
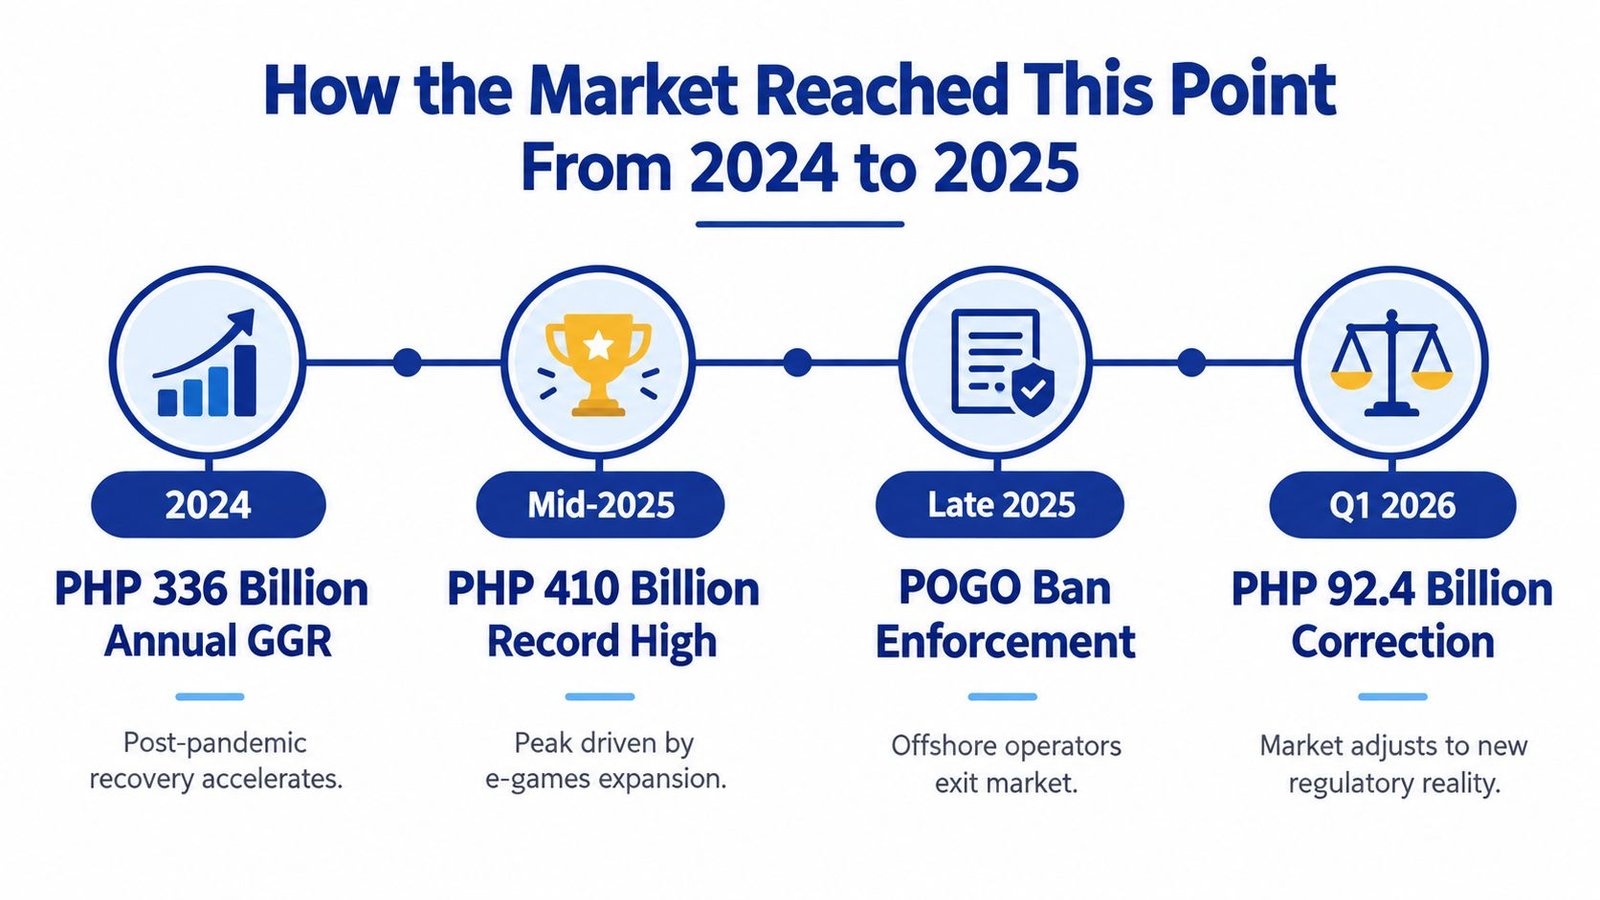
The market added PHP 23.81 billion in annual GGR between 2024 and 2025, reaching PHP 396.14 billion, up 6.4% from PHP 372.33 billion, according to Philstar's report on the 2025 revenue record. The increase concealed a major shift in revenue concentration.
Electronic and online gaming generated PHP 201.12 billion in 2025, slightly more than half of total industry revenue. It became the leading revenue source, overtaking traditional land-based casino floors and establishing digital distribution as the market's main growth engine before the 2026 correction.
From expansion to constraint
The 2025 record created a demanding comparison base for 2026. It also increased concentration risk. Once electronic gaming accounted for more than half of annual GGR, rules affecting that channel could influence the direction of the whole market.
Tighter online-gaming rules introduced in late 2025 changed the operating conditions. Customer acquisition, transaction processing, and continued market access became more dependent on regulatory compliance. The Q1 2026 contraction therefore signals a change in distribution economics, rather than an isolated product fluctuation.
Historical reporting also cited a possible 19% decline in full-year 2026 GGR, attributed to tighter online-gaming rules and weaker consumer spending. That projection remains a downside scenario, not a confirmed result. Operators and investors should use it to test exposure to electronic gaming, consumer demand, and regulatory restrictions.
The significance of the channel reversal
The sequence is clear:
- 2024 to 2025 growth: Total GGR rose from PHP 372.33 billion to PHP 396.14 billion, with the increase documented in Philstar's market coverage.
- 2025 structural crossover: Electronic and online gaming generated PHP 201.12 billion, moving above half of annual industry revenue.
- Q1 2026 correction: Licensed casinos became the largest source again as electronic gaming declined.
This reversal makes 2026 an inflection point, not a simple continuation of the growth trend. Licensed casinos re-anchored the market after electronic gaming contracted, while regulatory tightening became the decisive variable. The shift does not prove that land-based casinos will permanently lead. It shows that channel leadership can change quickly when regulation alters digital distribution costs and access. Operators should therefore assess revenue durability by licensing position, channel exposure, and compliance readiness. The PAGCOR regulatory developments provide relevant context for that assessment.
Segment Breakdown by Channel and Product
Q1 2026 revenue data shows a clear channel reversal. Licensed casinos generated the larger measured segment, while electronic gaming recorded the sharper annual decline. PAGCOR figures, summarized in Gaming and Betting Business Magazine's Q1 analysis, provide the available channel-level evidence.
Core segment comparison
| Segment | GGR Q1 2026 | Share of Total | YoY Change |
|---|---|---|---|
| Licensed casinos | PHP 44.52 billion | 50.83% | Not disclosed in verified data |
| Electronic gaming, including e-games, e-bingo, bingo, and poker | PHP 39.90 billion | Not separately stated beyond verified total context | Down 22.4% |
| Sports betting | Not separately disclosed | Not disclosed | Not disclosed |
| Esports and sweepstakes | Not separately disclosed | Not disclosed | Not disclosed |
The gaps matter. Verified Q1 data does not isolate sports betting, esports, or sweepstakes, so those categories cannot be assigned a share, growth rate, or ranking. International product mixes are not reliable substitutes because Philippine licensing categories and reporting conventions differ.
What the channel split means commercially
Licensed casinos held 50.83% of Q1 revenue, making physical venues the industry's primary measured revenue engine during the quarter. That position supports demand for casino management systems, surveillance, payments infrastructure, table technology, loyalty platforms, and hospitality-linked services. The figures do not establish growth for any individual supplier category.
Electronic gaming still produced PHP 39.90 billion, confirming a substantial digital revenue pool. Its 22.4% year-on-year decline changes the commercial risk profile. Operators may need to prioritize compliant retention, reliable payments, product depth, and customer protection over acquisition-led expansion.
Live casino products can fit within a regulated online portfolio, but inclusion does not remove licensing or compliance exposure. Businesses assessing live dealer casino games should evaluate studio partnerships, responsible-gambling controls, identity checks, and jurisdictional permissions together. Live content is a product option, not a standalone answer to regulatory pressure.
Portfolio implications
The comparison supports a barbell approach for investors. Licensed casino exposure provides current scale and market anchoring. Electronic gaming offers digital reach, yet its results appear more sensitive to regulatory decisions. The available figures do not support a precise view of sports betting or emerging verticals because PAGCOR's verified Q1 data does not report them separately.
That reporting limitation is itself an intelligence finding. Operators should require segment-level disclosure before underwriting growth, while suppliers should avoid treating total GGR as a proxy for addressable demand across every product category. The Q1 reversal therefore marks a market inflection point: licensed casinos re-anchored revenue after electronic gaming contracted, and regulatory tightening determined which channel could sustain scale.
Regulatory Shifts and Taxation Effects Shaping 2026
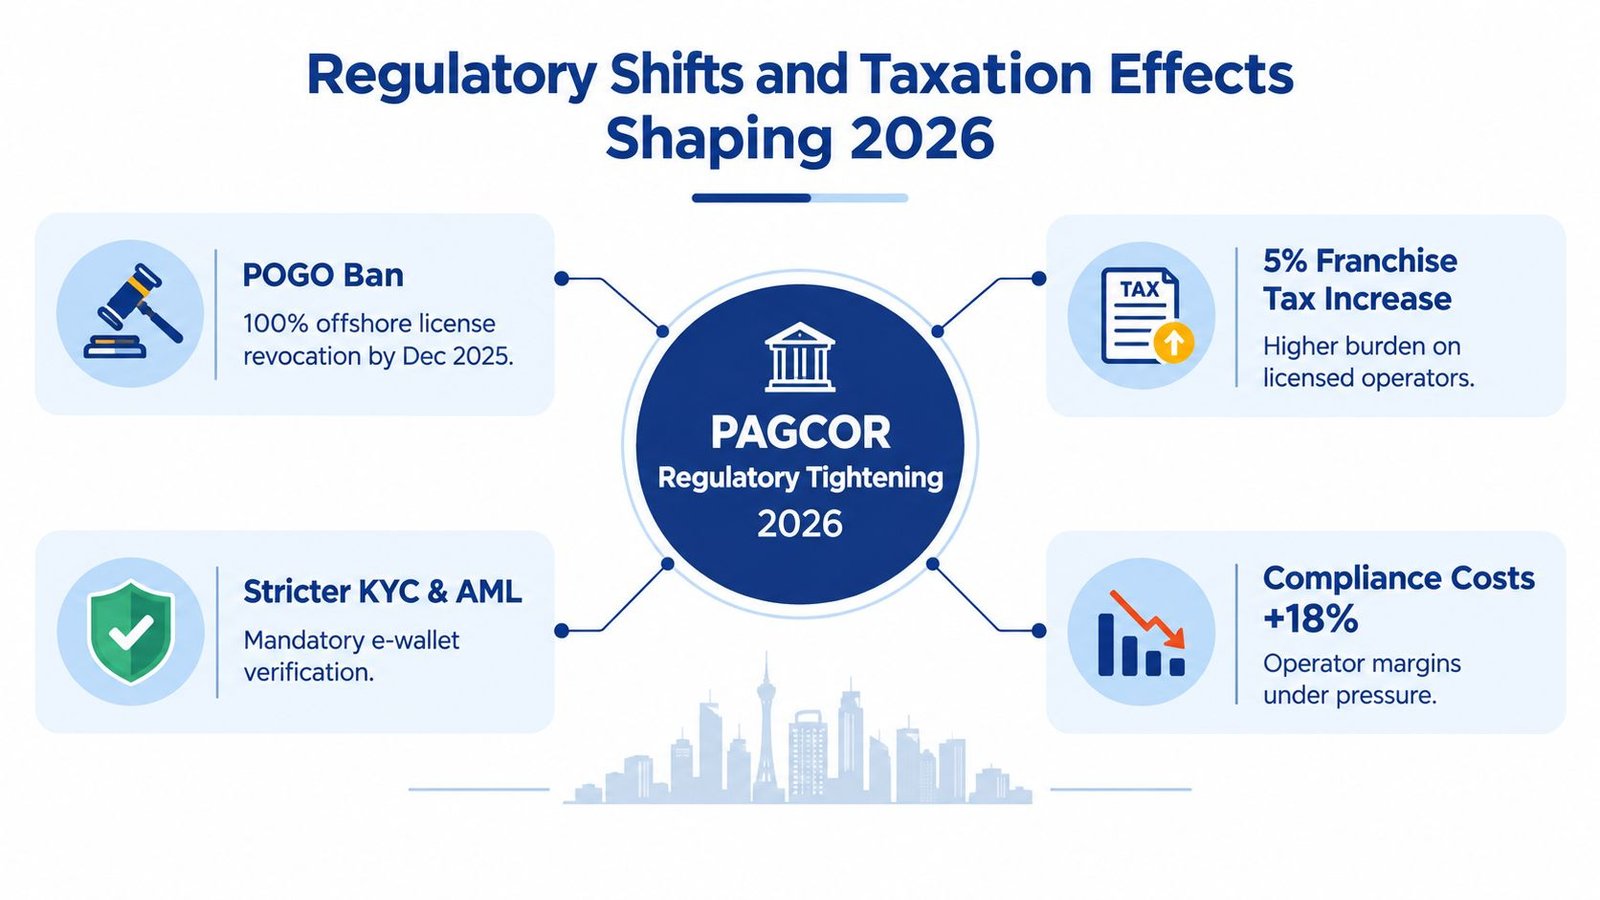
Regulatory tightening became the decisive variable in 2026. Late-2025 online-gaming restrictions weakened the electronic segment, while licensed casinos re-anchored the market. Pressure also reached PAGCOR's fiscal position, indicating that the policy reset affected both operators and the regulator.
PAGCOR warned lawmakers that its net income could fall 91% to PHP 1.66 billion in 2026. Total income was projected to decline 18% to PHP 86.95 billion, from PHP 106.03 billion in 2025, according to Philstar's report on PAGCOR's income outlook. These projections are not realized industry GGR, but they show how tighter gambling conditions and weaker profitability could reduce public revenue.
Why electronic operators feel the impact first
Electronic operators depend on continuous customer onboarding, accessible payments, advertising reach, and stable platform availability. Licensing enforcement and stronger controls turn each dependency into a potential operating constraint.
The Q1 decline in electronic GGR indicates that the regulatory reset affected the segment's performance, rather than only marginal operators. Electronic gaming had recently become the industry's largest annual revenue source, so its contraction changed the market's revenue balance. Licensing evidence, customer due diligence, responsible-gambling controls, and transaction monitoring now function as revenue-protection systems as well as legal safeguards.
Fiscal pressure changes stakeholder incentives
PAGCOR's projected income decline creates competing policy pressures. The regulator must protect licensing integrity and public-interest objectives while managing the fiscal effects of a smaller or slower gaming base. Operators must account for policy priorities that may shift as authorities balance enforcement, market activity, and public revenue.
Compliance implication: A business case built on rapid digital expansion is incomplete unless it models the cost of remaining licensed under tighter oversight.
PAGCOR B2B accreditation fees should be reviewed alongside platform costs, payment expenses, monitoring systems, and internal compliance staffing. The verified record does not provide a complete tax schedule or quantify any compliance-cost increase, so a precise margin impact cannot be assigned. The direction of risk is clearer: stricter conditions can reduce electronic volume while raising the standard for market participation.
Player Demographics Payments and Monetization Metrics
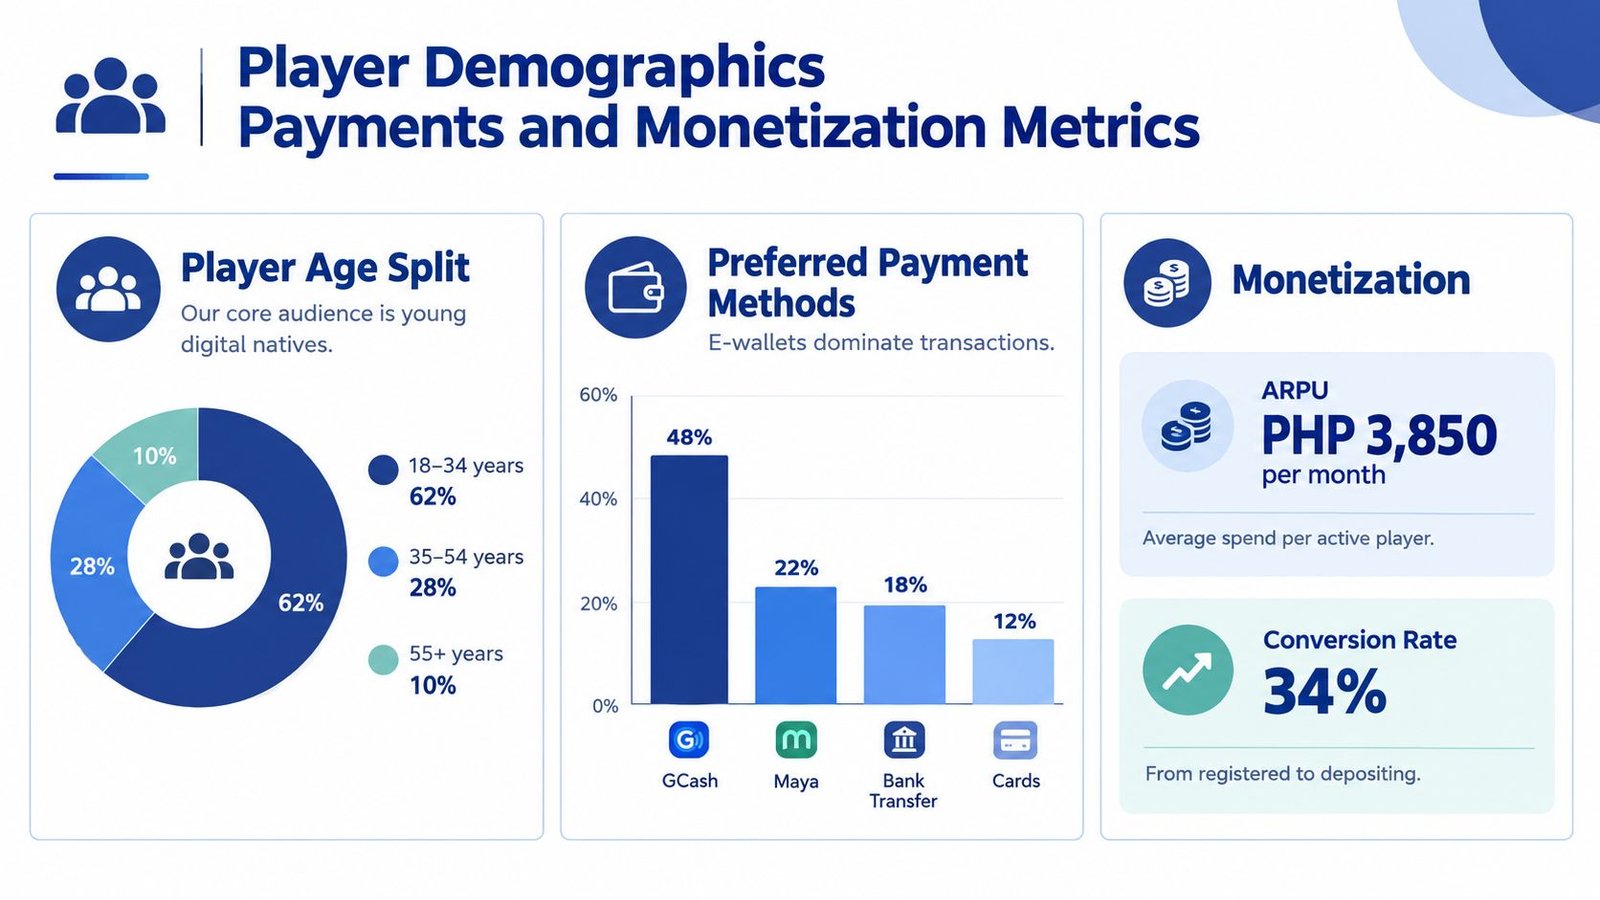
The verified Philippines gambling industry statistics for 2026 do not establish national benchmarks for player age, payment preferences, ARPU, conversion, or lifetime value. Operators and investors should not treat those measures as market facts without a primary PAGCOR disclosure, an operator filing, or a clearly defined research dataset.
This limitation changes how performance should be read. GGR measures industry revenue, while player economics show how that revenue is formed. They can indicate whether operators retain a stable core audience, replace churned customers, face payment friction, or depend on a narrower group of active players.
What operators should measure
A useful demand-side dashboard separates acquisition, activation, activity, and value. These indicators support operator analysis, but they are not verified national benchmarks:
- Audience composition: Track age bands, location, device, product preference, and responsible-gambling interactions through consented, privacy-compliant records.
- Payment behavior: Monitor deposit success, completed withdrawals, failed transactions, settlement time, and activity by approved payment rail.
- Monetization: Calculate ARPU by active-player cohort, product, acquisition source, and period. A single average can conceal material differences between cohorts.
- Retention and value: Estimate CLV from observed deposits, net gaming revenue, churn, bonus cost, payment expense, and compliance cost.
- Risk-adjusted contribution: Deduct incentives, payment fees, fraud losses, customer support, and regulatory overhead from gross value.
Why payment design now has strategic weight
With electronic gaming contracting, payment friction has a larger effect on realized revenue. Verification delays, failed deposits, or withdrawal restrictions can interrupt otherwise viable customer activity. Payment convenience without effective identity, affordability, and transaction controls creates a separate compliance risk.
The relevant question is not which payment method is preferred across the Philippines. It is which approved routes deliver reliable deposits and withdrawals for each legitimate customer cohort while meeting KYC, AML, and responsible-gambling requirements.
Acquisition economics also require compliance-adjusted measurement. A user acquisition cost framework should include verification failure, rejected traffic, promotional expense, retention, and the cost of servicing regulated customers. In a contracting electronic segment, cheap traffic may produce weak economics if its quality, legality, or retention is poor. Operators should therefore connect acquisition reporting to payment performance, cohort value, and compliance outcomes rather than evaluate volume alone.
Growth Drivers Forecasts and Risks Through 2026
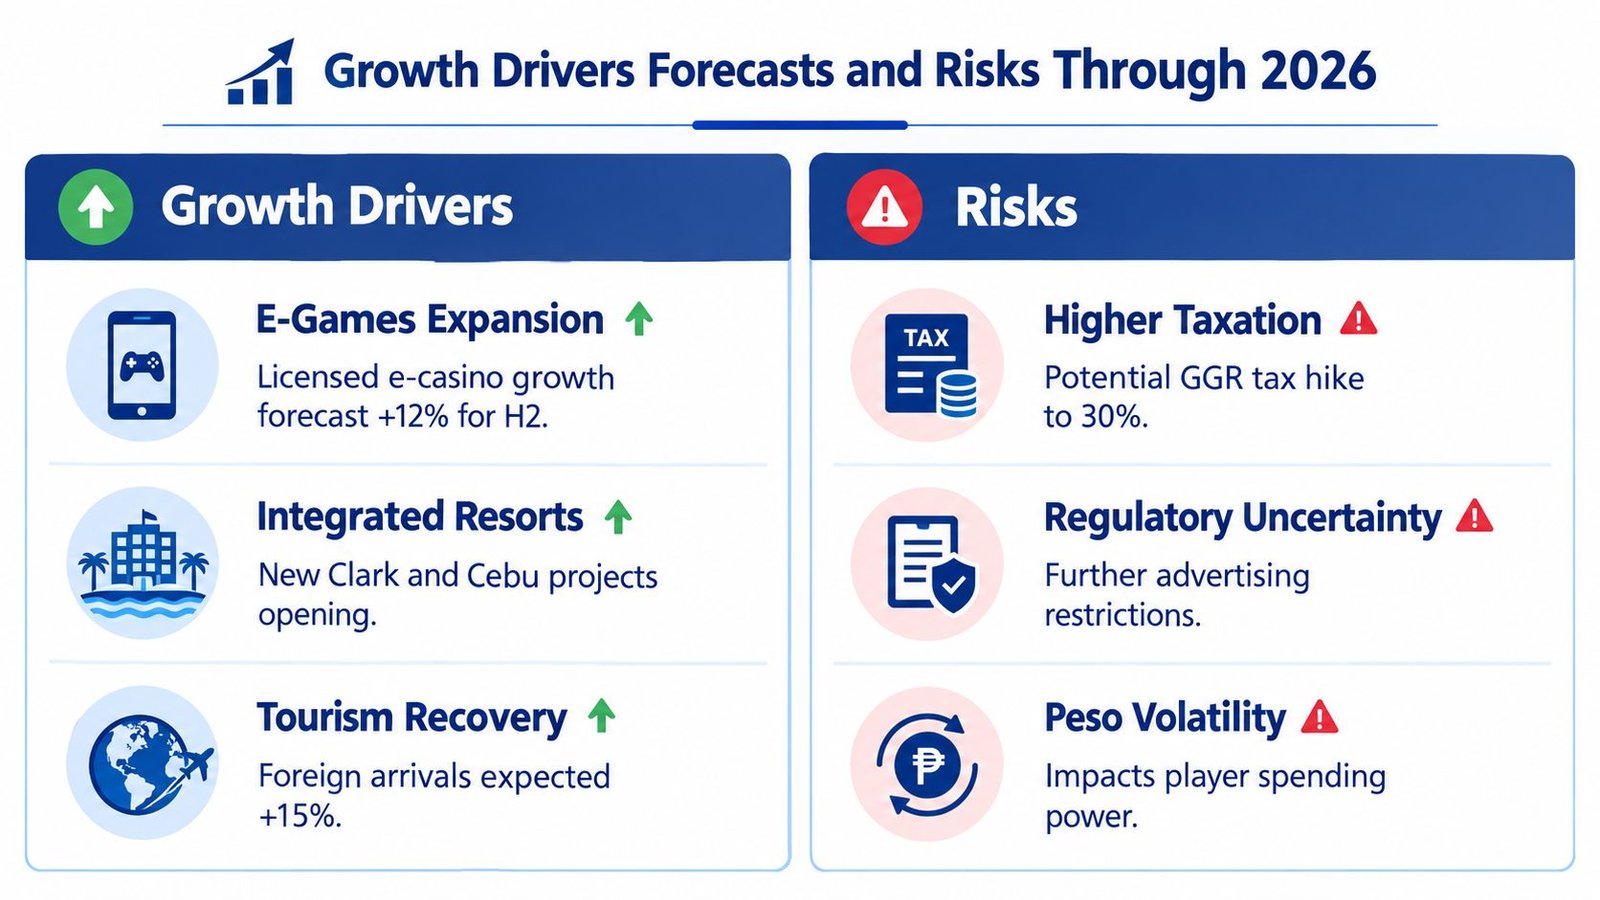
The case for a rapid 2026 recovery should be treated cautiously. One industry forecast cited a possible 19% full-year GGR decline, driven by tighter online-gaming rules and weaker consumer spending, while Q1 already showed a 15.87% year-on-year contraction in total GGR. The forecast is a scenario, not a confirmed result, but it gives decision-makers a credible downside frame.
Factors that could support resilience
Licensed casinos provide the clearest stabilizing factor because they already generated the largest share of Q1 GGR. Their revenue base is connected to physical venues, hospitality, entertainment, and destination activity, making it less dependent on the specific online distribution conditions that affected electronic gaming.
A recovery in electronic activity is also possible if licensed operators adapt successfully to the tightened framework. That outcome would require regulatory clarity, compliant customer acquisition, dependable payments, and products that retain users without relying on high-risk promotional practices. The available data doesn't justify assigning a percentage growth expectation to that scenario.
Risks that deserve priority
The downside case has three linked components:
- Regulatory overhang: Further restrictions could suppress electronic activity beyond the Q1 contraction.
- Consumer pressure: Weaker spending conditions could affect both online deposits and discretionary casino visits.
- Fiscal and operating strain: PAGCOR's projected income decline shows that pressure extends beyond private operators and may influence policy decisions.
The common mistake is to treat licensed casinos as a complete offset for electronic losses. They restored market leadership in Q1, but no verified evidence establishes that land-based growth will fully replace digital contraction across 2026.
Planning rule: Capital allocation should be stress-tested against a smaller electronic contribution, not against a return to the 2025 channel mix.
For operators, the preferred strategy is resilience over maximum reach. That means prioritizing licensed distribution, transparent reporting, controlled marketing, strong payments governance, and flexible supplier contracts. For investors, valuation work should distinguish stable casino exposure from electronic revenue that remains more vulnerable to enforcement and policy changes.
Methodology Sources and What to Watch Next
The Philippines gambling industry statistics 2026 in this analysis begin with official PAGCOR disclosures, supplemented by reporting that reproduces or interprets those figures. The Q1 baseline uses PAGCOR data. The historical 2025 comparison and PAGCOR income outlook are supported by Philstar reporting and the later income projection report.
The analysis separates three evidence levels:
- Observed market data: Reported GGR, segment contributions, year-on-year changes, and historical totals.
- Forward-looking estimates: Scenarios such as a possible full-year decline, which remain projections rather than realized results.
- Editorial interpretation: Judgments about channel risk, investment timing, compliance exposure, and portfolio construction.
What professionals should monitor
- Quarterly PAGCOR releases: Compare total GGR with licensed casino and electronic gaming performance. A single segment cannot represent the whole market.
- Regulatory announcements: Track licensing changes, enforcement actions, advertising rules, payment requirements, and responsible-gambling obligations.
- PAGCOR financial updates: Compare projected income with realized results to assess how market pressure may affect public-sector incentives.
- Channel mix: Monitor whether licensed casinos retain market leadership or electronic gaming recovers under the revised framework.
- Data definitions: Confirm whether each figure represents GGR, income, net income, handle, or another measure before making comparisons.
No verified dataset used here supports national claims about player demographics, payment preferences, ARPU, CLV, sports betting share, esports, or sweepstakes. These topics require separate, transparent sources and should not be combined with the official GGR baseline.
The next meaningful signal will be the relationship between total GGR, electronic recovery, licensed casino resilience, and the regulatory costs assigned to each channel. That interaction will indicate whether 2026 was a temporary correction or a durable restructuring in which tighter oversight re-anchored the market around licensed casinos.
Operators, suppliers, investors, and compliance professionals can use the Q1 baseline as a monitoring framework, then follow Top 1 Rank for verified PAGCOR updates, regulatory analysis, channel intelligence, and data-led coverage of the Philippines gambling market.





Join thousands of gaming professionals receiving the latest iGaming news, regulatory updates, and market insights.
