

PAGCOR is guiding 2026 Philippine gaming GGR toward roughly PHP320 billion, around 19% below the PHP396.14 billion record set in 2025. Electronic gaming is the primary drag, with weaker digital revenue offsetting the resilience of licensed land-based casinos.
That headline captures more than a down year. It marks a change in the market's operating mechanism. In the first quarter of 2026, total GGR reached PHP87.60 billion, down 15.87% from PHP104.12 billion a year earlier, while electronic gaming contributed PHP39.90 billion, nearly matching licensed casinos at PHP44.52 billion (PAGCOR). By the second quarter, GGR stood at PHP88.13 billion, down 20.33% year on year, even as licensed casinos increased their contribution to PHP45.4 billion (SCCG Management's PAGCOR-linked report).
The central issue for operators, suppliers, affiliates, regulators, and investors is therefore not whether regulation reduced demand. It's which part of the digital mix is contracting, how payment and compliance friction reaches player activity, and whether land-based strength can compensate.
Table of Contents
- Why 2026 Is a Reset Year for Philippines Gaming
- 2024 and 2025 GGR Baseline Before the Slowdown
- Quarterly Performance in 2026 and the Segment Story
- How PAGCOR Built Its 2026 GGR Forecast
- The Drivers Behind the 2026 Decline
- Segment Outlooks Across Online Retail and Land Based
- Strategic Actions for Operators Affiliates and Investors
- Key Numbers and Indicators to Watch Through Year-end
Why 2026 Is a Reset Year for Philippines Gaming
The 2026 Philippines gaming GGR outlook points to a structural reset after the market's record year. PAGCOR's working guidance of approximately PHP320 billion implies a decline of around 19% from PHP396.14 billion in 2025 (CDC Gaming).
The scale of the pullback reflects the market's changing revenue mix. Online and electronic gaming produced PHP201.12 billion in 2025, more than half of total industry revenue, and had become the sector's main growth engine (Philstar). That concentration now amplifies weakness. Electronic gaming remained close to licensed casinos in the first half of 2026, but its decline is doing more to reduce total GGR than land-based performance.
The market question is now about transmission
Calling the slowdown a regulatory effect alone obscures how the pressure reaches player activity. The more useful framework separates policy restrictions, payment friction, and softer discretionary spending. S&P-linked commentary identified tighter digital-payment rules and inflationary spillovers from Middle East tensions as first-quarter drags, while PAGCOR-linked reporting associated second-quarter weakness with electronic gaming and consumer softness (PhilGamingIntel).
Each pressure point has a different commercial effect:
- Payment friction interrupts deposits, withdrawals, onboarding, and repeat play.
- Advertising constraints reduce acquisition efficiency and can narrow the flow of qualified traffic.
- Consumer softness lowers playing frequency or spend even when accounts remain accessible.
- Geopolitical spillovers pressure household budgets without directly changing gaming rules.
The evidence supports a digital-mix explanation for the reset. Land-based casinos are showing greater resilience, while electronic channels carry most of the contraction.
That distinction should shape decisions through the rest of the year. Operators need to protect compliant digital conversion instead of assuming additional promotions will restore earlier volumes. Affiliates should reassess traffic sources that depend on easy payment access or social-led acquisition. Investors should test whether Philippine exposure in broader Asia-Pacific portfolios reflects a temporary slowdown or a permanently lower digital run rate.
2024 and 2025 GGR Baseline Before the Slowdown
PAGCOR's verified baseline shows a market that expanded sharply into 2025. Philippine gaming GGR reached PHP396.14 billion in 2025, up 6.39% from PHP372.33 billion in 2024, according to Philstar. The record matters because digital channels had already become the market's largest combined revenue source before the 2026 slowdown appeared in quarterly results.
Online and electronic gaming generated PHP201.12 billion in 2025, more than half of total GGR. This composition made the market more exposed to payment access, enforcement intensity, and changes in player affordability than a sector dominated by destination casinos.
The mechanism behind the contraction matters more than the headline decline
The verified material does not provide a complete, like-for-like breakdown for licensed casinos, Casino Filipino, electronic games, and licensed online gaming across both years. A detailed segment table would therefore imply precision that the available data cannot support.
| Segment | 2024 GGR (PHP bn) | 2025 GGR (PHP bn) | YoY Change |
|---|---|---|---|
| Total Philippine gaming market | 372.33 | 396.14 | 6.39% |
| Online and electronic gaming | Not disclosed in verified data | 201.12 | Not comparable |
| Licensed casinos | Not disclosed in verified data | Not disclosed in verified data | Not disclosed |
| PAGCOR-operated casinos | Not disclosed in verified data | Not disclosed in verified data | Not disclosed |
The defensible conclusion concerns mix, rather than historical growth rates for every subsegment. Digital gaming was the dominant revenue engine entering 2026, while licensed casinos remained the largest individual segment in the first two quarters of that year. The baseline therefore points to a digital-mix problem: electronic channels had enough weight to pull down the total even if land-based activity held up better.
A record sector GGR figure also does not translate directly into the same growth rate for PAGCOR income. Regulator income depends on applicable regulatory and remittance arrangements, as well as the amount wagered and won across the market. The verified guidance placed PAGCOR's 2026 income at around PHP86.95 billion to PHP87 billion, about 18% below 2025, but the available information does not isolate the effect of individual tax frameworks.
For 2026 analysis, PHP396.14 billion is the correct peak-year reference point. It captures the market before payment and demand pressures became visible in reported quarterly results. It shows why a contraction concentrated in electronic channels can produce a larger headline decline than a broadly similar reduction in land-based gaming.
Quarterly Performance in 2026 and the Segment Story
As detailed above, Q1 GGR fell 15.87% year on year to PHP87.60 billion. Q2 reached PHP88.13 billion, still below the comparable 2025 quarter, but slightly higher than Q1. The sequence indicates quarterly resilience within a weaker annual base, rather than a return to the market's previous growth path (SCCG Management).
Licensed casinos are not the headline drag
Licensed casinos generated PHP44.52 billion in Q1, or 50.83% of total GGR, and PHP45.4 billion in Q2, or 51.5%. The Q2 result increased 2.9% year on year and 1.9% quarter on quarter, according to PAGCOR-linked reporting (Yogonet).
Electronic gaming contributed PHP39.90 billion in Q1 and PHP39.9 billion in Q2, representing 45.55% and 45.2% of each quarter. Its near-parity with licensed casinos matters more than the small quarter-to-quarter movement. A digital segment of this scale can pull down total GGR even when land-based casinos are stable or growing.
| Segment | Q1 2026 GGR (PHP bn) | Q2 2026 GGR (PHP bn) | QoQ Change |
|---|---|---|---|
| Total GGR | 87.60 | 88.13 | Not disclosed |
| Licensed casinos | 44.52 | 45.4 | 1.9% |
| Electronic gaming | 39.90 | 39.9 | Not disclosed |
| PAGCOR-operated casinos | 3.17 | Not disclosed | Not disclosed |
PAGCOR-operated casinos generated PHP3.17 billion, or 3.62% of Q1 GGR. Verified Q2 information does not provide a comparable figure, leaving an important gap in the quarterly bridge. The same limitation applies to a detailed Q2 split within electronic gaming.
The segment mix provides the clearest explanation for the headline decline. Licensed casinos acted as a partial stabilizer, while electronic gaming supplied the larger negative pressure because of its scale and digital exposure. Payment-rail friction and softer consumer demand would therefore affect the total through online activity first, while geopolitical spillovers can weaken both confidence and discretionary spending. H2 results will show whether this lower quarterly run rate persists and whether PAGCOR's full-year guidance remains attainable.
How PAGCOR Built Its 2026 GGR Forecast
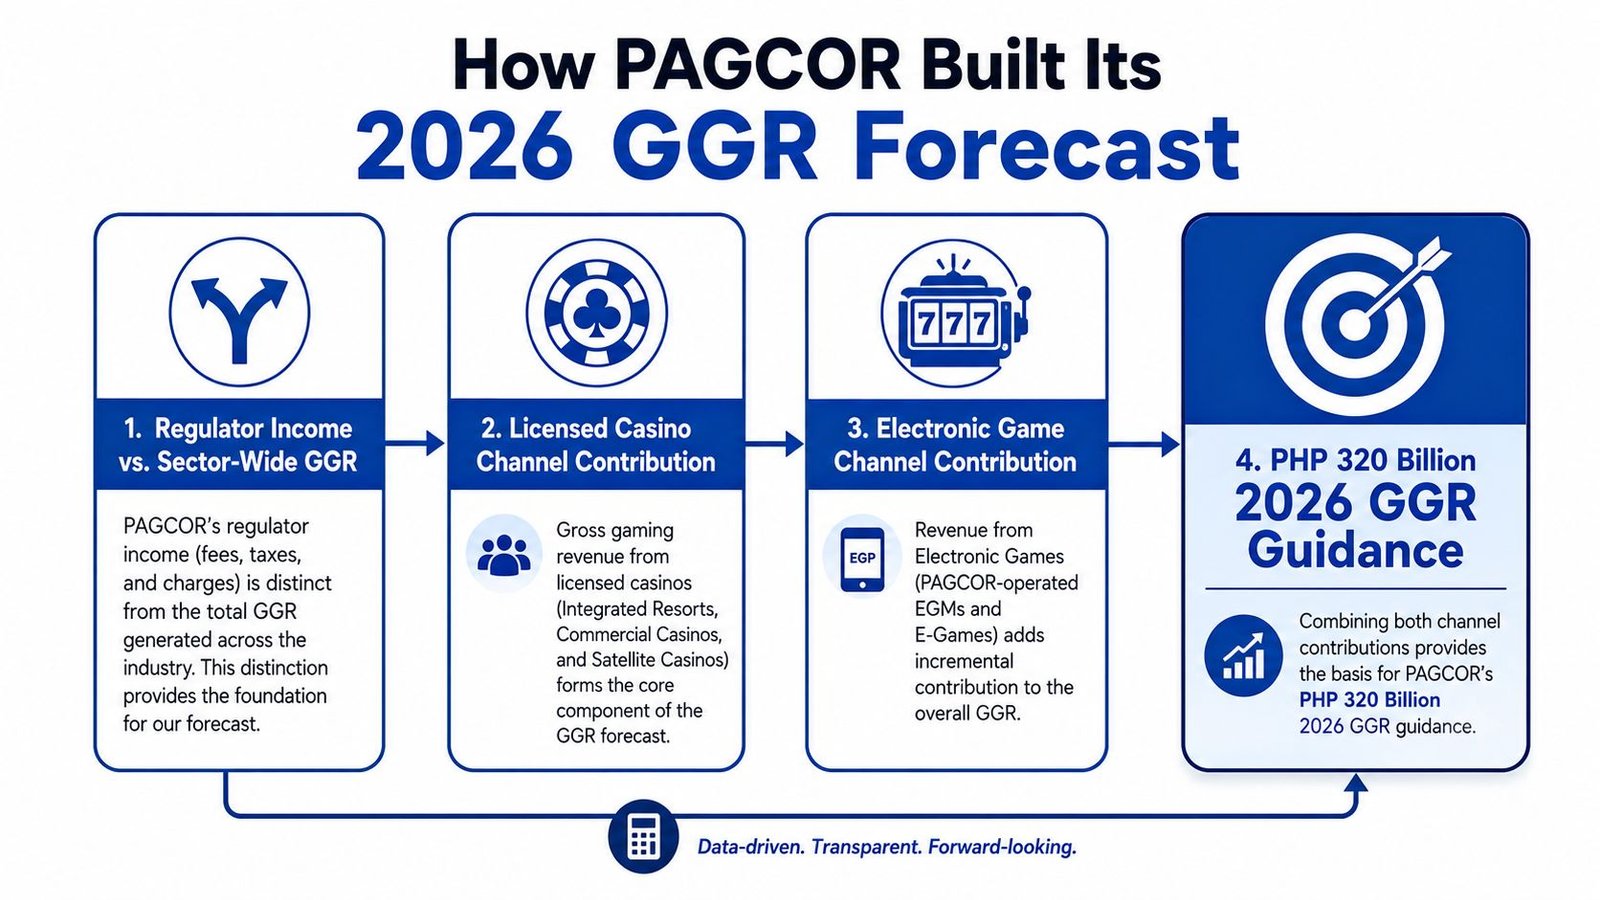
PAGCOR's forecast requires a distinction between market production and regulator receipts. Sector GGR measures gaming revenue generated across the Philippine market, while PAGCOR income reflects the regulator's share under its operating and regulatory arrangements. These measures can move at different rates, so income guidance cannot serve as a direct substitute for a GGR forecast.
PAGCOR's income outlook was reported at approximately PHP86.95 billion to PHP87 billion, around 18% below 2025. That gap makes the income-versus-GGR distinction more than a reporting detail. It shows why analysts should test the market's segment mix and quarterly run rate rather than infer sector performance from regulator receipts alone, as reported by Philstar.
Four inputs shape the forecast
Separate income from GGR. The regulator's target reflects its own collection structure. Market GGR reflects player spending and operator activity across channels.
Weight licensed casinos. Licensed casinos were the largest individual channel in both reported 2026 quarters. Their stability can offset part of the weakness elsewhere, but cannot fully neutralize a large digital slowdown.
Model electronic gaming separately. Electronic gaming was nearly as large as licensed casinos and carried greater exposure to payment-rail friction, player affordability, and digital enforcement. That makes it the main downside sensitivity in the forecast.
Test the annual run rate. H1 GGR offers the practical test of whether the annual outlook remains reachable. Quarterly performance near PHP88 billion would imply a materially lower annual outcome than the record-year baseline, although H2 activity determines the final result.
Public commentary also included a 7% 2026 revenue decline projection associated with S&P commentary. That estimate should remain separate from PAGCOR's own sector framing because the measures and baselines differ, rather than being blended into a single forecast.
Operators reviewing the regulatory assumptions can consult these PAGCOR regulatory updates for 2026. The published material does not disclose a full elasticity model for payment friction, advertising limits, player spend, or offshore-facing activity. H2 segment data therefore carries more analytical weight than any single forecast label.
The Drivers Behind the 2026 Decline
The 2026 contraction reflects four connected pressures, but they do not carry equal evidentiary weight. Electronic gaming is the clearest measurable drag. Payment-rail friction restricts completed transactions, tighter digital enforcement weakens acquisition, softer household spending reduces play, and geopolitical spillovers add pressure to discretionary budgets.
Payment rails turn regulation into lost activity
S&P-linked commentary identified tighter rules affecting digital payments as a Q1 pressure, as noted earlier. The mechanism is straightforward. A player may still want to use a product, yet fail to complete a deposit or withdrawal. Revenue is lost before the wager or game session begins.
Published market data does not quantify GCash or Maya failure rates, conversion declines, or the effect of any individual wallet rule. Those measures belong in operator-level diligence, alongside deposit completion, withdrawal success, and repeat-player activity. The distinction matters because payment friction can reduce GGR without proving that consumer interest has disappeared.
Advertising and affordability affect the funnel differently
Tighter online-gaming controls can raise compliance costs and limit how operators acquire and retain players. Available evidence supports a broader enforcement shock, but does not establish a verified percentage for acquisition losses or identify one PAGCOR advertising rule as the sole cause of the decline.
Consumer softness affects a later part of the funnel. Lower discretionary capacity can reduce play frequency, average spend, and the likelihood that a player returns after a failed payment or less visible promotion. S&P-linked reporting also associated Middle East tensions with inflationary spillovers, connecting external price pressure with household gaming budgets (Philstar).
| Driver | Channel Most Affected | Estimated GGR Impact |
|---|---|---|
| Digital-payment friction | Electronic and online gaming | Not separately quantified in verified data |
| Tighter online enforcement | Digitally distributed products | Not separately quantified in verified data |
| Softer discretionary spending | Electronic gaming and retail play | Not separately quantified in verified data |
| Geopolitical inflationary spillovers | Digital and land-based discretionary play | Not separately quantified in verified data |
The strongest conclusion comes from the segment mix rather than from a single causal estimate. No verified source isolates one rule or macroeconomic variable as responsible for the full decline. The quarterly pattern instead indicates that digital weakness has the largest measurable connection to the headline result, while land-based resilience limits, but does not erase, the fall.
Operators assessing market-entry economics should review the PAGCOR B2B accreditation fees. The key commercial question is whether payment and compliance friction eases before electronic gaming loses further share, or whether the market settles at a lower digital baseline.
Segment Outlooks Across Online Retail and Land Based
The 2026 outlook separates by channel. Licensed casinos remain comparatively resilient in the quarterly data, while electronic gaming supplies the clearest measurable drag. Online betting and casino products retain strategic importance, but their digital distribution makes payment access, compliance, and customer acquisition more sensitive to current market conditions.
Online betting and casino
Online products represented more than half of 2025 GGR when online and electronic categories were combined. The 2026 evidence points to a market that remains material but has less room for growth, with digital exposure now carrying greater downside risk.
Operators should assess online performance through operating signals rather than headline volume. Deposit completion, withdrawal reliability, repeat-player activity, and traffic from compliant owned channels show whether demand is weakening or whether payment friction is interrupting otherwise viable play. A useful reference for market rules and licensing context is this Philippines online casino and PAGCOR guide.
Electronic games
Electronic gaming has the clearest negative direction. Its near-flat quarter-over-quarter performance signals a stalled recovery rather than stabilization. The segment remains close to licensed casinos in scale, yet total GGR still fell sharply year on year, making electronic gaming the segment most closely connected to the headline decline.
This distinction matters for forecasting. A flat contribution would stop further deterioration, but it would not restore the stronger growth profile seen before the slowdown. Continued weakness would place the PHP320 billion guidance at risk. The key test is whether payment and compliance conditions improve enough to revive activity, not whether the segment avoids another quarterly fall.
Retail casinos and suppliers
Licensed casinos generated the largest individual share in both Q1 and Q2, and Q2 revenue increased year on year. Land-based gaming therefore acts as the defensive part of the current mix. The verified data does not support a precise forecast for Entertainment City, Clark, VIP, or premium-mass subsegments, so resilience should not be treated as uniform across every property or customer group.
B2B suppliers should divide exposure by customer type. Providers serving electronic and online operators face greater volume sensitivity than suppliers tied to resilient licensed casinos. Available evidence does not quantify margin compression or equipment-order changes, leaving client mix, renewals, and order timing as practical indicators rather than measured GGR forecasts.
| Segment | 2026 GGR Direction | Magnitude | Key Signal to Watch |
|---|---|---|---|
| Online betting and casino | Flat to down | Not quantified | Payment completion and repeat activity |
| Electronic gaming | Down | Primary measurable drag | Quarterly electronic GGR |
| Licensed retail casinos | More resilient | Q2 increased year on year | Sustained licensed-casino GGR |
| B2B suppliers | Mixed | Depends on customer exposure | Client mix and renewal activity |
The strategic distinction is clear: land-based resilience is cushioning the decline, not reversing it. The headline result will improve only if digital activity recovers, because that is where the measurable weakness is concentrated.
Strategic Actions for Operators Affiliates and Investors
Given the PHP320 billion guidance established earlier, operators should prioritize cash-flow protection and digital conversion quality rather than pursue a single recovery plan. The 2026 contraction is concentrated in the digital mix, while licensed casinos show greater resilience.

Tier one for licensed casino operators
Licensed casinos have the strongest verified position, with Q2 GGR rising 2.9% year on year and 1.9% quarter on quarter. Their priority should be yield quality rather than indiscriminate volume.
- Measure yield per visitor: Revenue quality matters more than promotional reach while total market GGR remains under pressure.
- Reduce reliance on fragile junket channels: Customer diversification can limit exposure to one acquisition source, although verified data does not quantify junket performance.
- Stage capital spending: Match integrated-resort investment to observed visitation and premium demand, rather than the 2025 peak alone.
Tier two for online operators and e-games
Digital operators need operational redundancy. Payment-failure monitoring, compliant creative testing, and channel diversification should accompany product and promotional decisions.
Internal dashboards should track payment attempts, completed deposits, withdrawal resolution, active-player churn, and electronic GGR by venue or product. Tracking deposits alone can conceal the point at which payment-rail friction reduces repeat activity.
Practical rule: Treat payment reliability as a revenue metric, not only as a compliance or technology metric.
Affiliates should model downside against the guidance established earlier and avoid assuming traffic growth will offset weaker conversion. Search, direct partnerships, and compliant content can reduce dependence on one acquisition route. The available evidence does not support a specific expected percentage decline in acquisition efficiency, so partners should test conversion and retention by channel rather than rely on a fixed assumption.
Tier three for suppliers and investors
B2B suppliers should classify customers by digital exposure before extending capacity or pricing concessions. Investors should compare free-cash-flow resilience with the sector's possible 19% decline, rather than extrapolating from one quarter, as noted earlier.
A closer review of cost-reduction strategies for gaming businesses can support operating-model analysis. Companies with strong licensed-casino exposure may withstand the reset better than those dependent on electronic volume, offshore-facing payment flows, or acquisition channels vulnerable to enforcement. The appropriate allocation therefore depends on customer mix, payment performance, and the speed of digital recovery.
Key Numbers and Indicators to Watch Through Year-end
The year-end dashboard should track market size, segment direction, and regulator income separately. A single GGR headline cannot show whether weakness comes from electronic gaming, licensed casinos, or PAGCOR's own revenue base.
Full-year GGR remains the broadest measure, with 2025's PHP396.14 billion baseline set against a 2026 outlook near PHP320 billion and a wider reported range reaching PHP350 billion. The quarterly pattern adds context. Q2 was only modestly above Q1, with the gap narrowing to PHP0.53 billion, yet the year-on-year decline widened to 20%. That combination suggests limited seasonal momentum and persistent pressure beneath a relatively stable quarterly run rate.
The segment split is more informative than the total. Electronic gaming GGR remained around PHP39.9 billion in both quarters, while licensed casinos rose from PHP44.52 billion to PHP45.4 billion. Licensed casinos are therefore cushioning the market, whereas digital activity is the segment preventing a stronger recovery. The key H2 question is whether electronic gaming can hold its recent level or begin another step down.
PAGCOR income guidance, at PHP86.95 billion to PHP87 billion, also deserves separate monitoring because it measures the regulator's income base rather than sector GGR. A weaker digital mix can affect these measures differently, depending on how activity shifts across licensed venues and electronic channels.
Operators should pair PAGCOR releases with payment-failure rates, active-player retention, acquisition-channel performance, and venue-level electronic results. Affiliates can apply this user-acquisition-cost framework to test whether traffic remains profitable as conversion and repeat activity weaken. The useful signal is not a universal cost benchmark, but the direction of CPA, first-time-depositor conversion, and retained players by channel.
For H2, payment reliability and affiliate CPA may provide earlier warnings than reported GGR. Rising failure rates can suppress deposits before they appear in quarterly results, while higher acquisition costs can reveal deteriorating digital demand even if headline revenue holds.
Decision-makers should therefore test whether electronic gaming stabilizes while licensed casinos preserve their resilience. If both conditions fail, the Philippines enters 2027 with a lower digital revenue base, rather than a temporary quarterly dip.





Join thousands of gaming professionals receiving the latest iGaming news, regulatory updates, and market insights.
