


The global gambling market is projected to approach US$700 billion by 2028, following an estimated US$536 billion in revenue in 2023, but that headline obscures more than it reveals. The total blends regulated and unlicensed activity, online and land-based channels, lottery products and operator-led gambling, while leaving consumer-finance harm outside the revenue calculation. The World Health Organization's gambling overview provides the appropriate caution: market expansion and sustainable performance aren't interchangeable.
For operators, suppliers, regulators, investors and affiliates, effective gambling industry analysis starts with segmentation. The relevant question is not just whether gross gambling revenue is rising. It is whether growth comes from durable channel migration, stronger product economics, improved customer value and resilient regulation, or from concentrated losses among vulnerable players and activity that can move offshore when controls tighten.
Table of Contents
- What Gambling Industry Analysis Actually Measures in 2026
- Reading Great Britain as a Mature Regulated Benchmark
- Operator KPIs Beyond Headline GGY
- How New Jersey Complements the UK Picture
- The Channelization Problem After Legalization
- Online Slots Stake Rules Ceilings
- Are Responsible Gambling Controls Actually Working
- A Practical Analyst Checklist for Any Market
What Gambling Industry Analysis Actually Measures in 2026
A useful analysis moves through five layers: jurisdictional performance, operator KPIs, M&A activity, regulatory impact, and harm or consumer-finance signals. Each layer answers a different question. Jurisdictional data shows where demand is legal and measurable. Operator KPIs explain how revenue is produced. M&A activity indicates where capital expects future strategic value, although transaction logic must be tested against regulation and cash generation. Regulatory analysis tests the durability of the commercial model. Consumer-finance data asks who ultimately bears the cost of expansion.
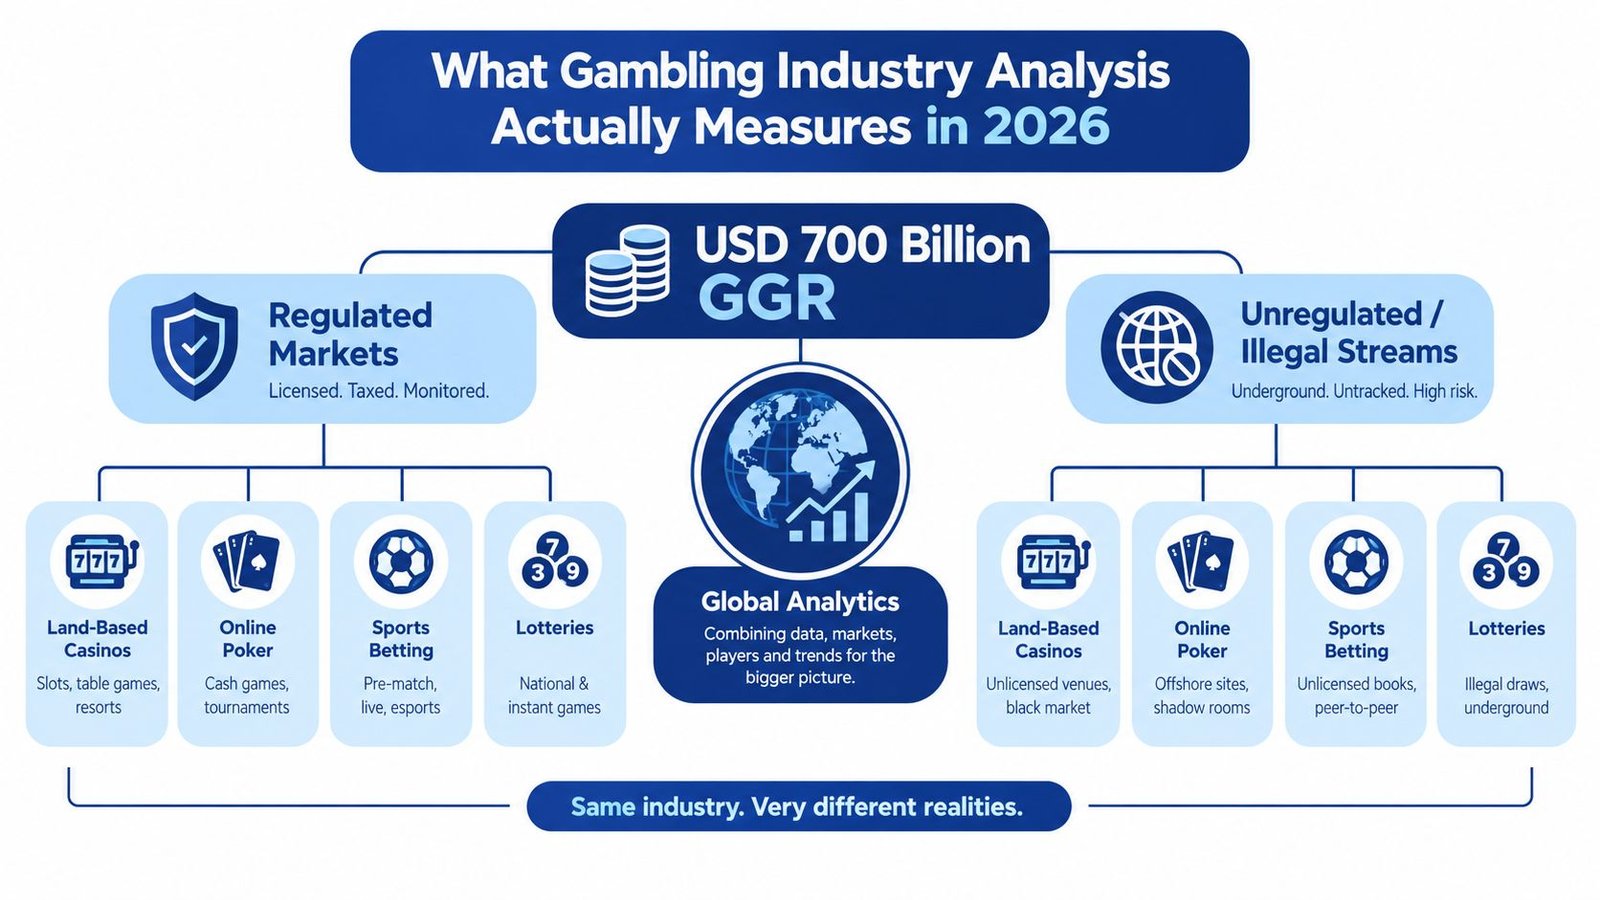
The terms that prevent bad comparisons
Gross gambling revenue, or GGR, generally describes stakes retained after winnings are paid, before certain deductions. Net gaming revenue, or NGR, goes further by reflecting deductions such as bonuses or promotional costs, depending on the operator's reporting definition. Analysts shouldn't compare GGR from one business with NGR from another.
Gross gambling yield, or GGY, is the principal term used in Great Britain. Handle refers to the amount wagered, not the operator's retained revenue. A market can therefore record higher handle without equivalent GGR growth if the hold, product mix or promotional intensity changes. The theoretical win rate is the expected operator edge over repeated play, while actual hold can vary materially over shorter periods.
That distinction matters because a revenue increase can coexist with fewer bets, weaker retail activity or higher exposure to a narrow player cohort. A review of PAGCOR regulatory developments in 2026 can add jurisdiction-specific context, but no single licensing or market-size figure replaces channel-level analysis.
Analytical rule: A market-size estimate is an entry point, not an investment thesis. The thesis begins when revenue, activity, regulation and player outcomes are reconciled.
Reading Great Britain as a Mature Regulated Benchmark
Great Britain offers one of the clearest public benchmarks for a mature, regulated gambling market. In the financial year from April 2024 through March 2025, customer-facing gambling generated £16.8 billion in GGY, up 7.3% year over year. Excluding reported lotteries, GGY reached £12.6 billion, an increase of 9.3%. The Gambling Commission's annual industry statistics show why analysts must separate lottery economics from operator-driven casino, betting and bingo activity.
| Channel | 2024/25 GGY (£bn) | YoY Change | Share of Total |
|---|---|---|---|
| Remote casino, betting and bingo | 7.8 | Increased, with online gambling the principal growth engine | 46% |
| Non-remote sectors | 4.8 | Not separately stated in the verified dataset | 29% |
| Licensed lotteries | 4.2 | Not separately stated in the verified dataset | 25% |
| Total industry | 16.8 | +7.3% | 100% |
The first correction is mathematical, but the second is economic. Lottery revenue materially expands the headline total, yet lottery products don't carry the same product mix, customer-acquisition model or margin structure as online casino and sportsbook operations. Removing reported lotteries produces a cleaner view of the operator-led market and avoids treating a state-licensed lottery rebound as evidence of broad-based digital strength.
Online gambling generated £7.8 billion, accounting for 46% of total industry GGY, while non-remote sectors produced £4.8 billion. Online activity was the principal growth engine, increasing by more than £900 million year over year. That combination points to continued digital expansion alongside a land-based sector that remains commercially material rather than irrelevant.
The market also shows why a single growth rate is insufficient. Analysts need channel share, product category, activity volume and customer spend before deciding whether growth reflects genuine demand, mix changes or pricing effects. A separate overview of online casino regulation in the Philippines illustrates why jurisdictional comparisons should also account for licensing design and market maturity, not just top-line revenue.
Operator KPIs Beyond Headline GGY
The Gambling Commission's operator-level data for January to March 2025 separates revenue from activity more clearly than an annual market total. Total online GGY rose 7% year over year to £1.45 billion. Online real-event betting increased 5% to £596 million, while online slots rose 11% to £689 million. The regulator's operator data through March 2025 shows slots contributing more strongly to digital expansion than betting during that quarter.
Four cuts that change the interpretation
Product mix reveals where revenue is concentrated. Slots grew faster than real-event betting in the reported quarter, so a digital operator with strong GGY growth may be more exposed to slot regulation and slot-specific player risk than its corporate label suggests.
Activity volume tells a different story. Online bets and spins declined 5% to 3.1 billion even as online GGY increased. Revenue therefore wasn't a function of more transactions. Yield per bet or spin, product mix, pricing, customer segmentation and promotional intensity all become plausible explanatory variables.
Retail performance supplies a useful counterweight. Over-the-counter bets fell 6% year over year to 129 million, while retail betting GGY remained broadly stable at £152 million. Machine GGY declined 5% to £276 million, although average spend per session rose by 3 pence to £12.19. A smaller activity base with stable revenue can indicate changing customer value, but it can also concentrate exposure among more active users.
Geography matters for multinational operators, yet the verified quarter-level figures don't provide a UK-versus-overseas split. Analysts should obtain that disclosure before assigning the UK trend to a group's consolidated results. Customer-acquisition economics, including user acquisition cost analysis, should be paired with retention, product mix and risk exposure rather than viewed in isolation.
| Metric | Operator A | Operator B |
|---|---|---|
| Revenue profile | Slots-led digital GGY | Betting-led digital GGY |
| Activity signal | Lower transaction volume with higher yield | Higher activity sensitivity to event cycles |
| Regulatory exposure | More directly exposed to slot-stake rules | More exposed to betting and marketing restrictions |
| Risk question | Is revenue concentrated among high-value slot users? | Does engagement depend on promotional intensity? |
The table is an analytical comparison, not a claim about named companies. Two operators can report similar revenue while carrying opposite margin, product and consumer-risk profiles.
How New Jersey Complements the UK Picture
Great Britain and New Jersey measure related markets through different reporting lenses. Great Britain's GGY framework offers a mature, national view across remote, non-remote and lottery activity. New Jersey's regulated market reports internet gaming win, a measure relevant to casinos and their commercial partners.
In November 2025, New Jersey casino internet-gaming win reached $253.0 million, up 18.2% from $214.0 million in November 2024. Through November, cumulative gaming win reached $2.64 billion, compared with $2.16 billion in the comparable prior-year period, an increase of 22.2%. The New Jersey Division of Gaming Enforcement release makes the figures useful for investors assessing digital expansion and market-access partnerships.
The comparison is valuable because New Jersey exposes the economics of a regulated US state market, while Great Britain provides a broader mature-market benchmark. New Jersey's figures are particularly relevant to casino operators, platform suppliers and market-access partners because the reported measure covers casinos and partners rather than an isolated technology layer.
| Dimension | Great Britain | New Jersey |
|---|---|---|
| Core measure | Gross gambling yield | Internet gaming win |
| Geographic scope | National regulated market | State-level regulated market |
| Main analytical use | Channel maturity and product mix | Digital casino growth and partnership economics |
| Key caution | Lottery activity can inflate the headline total | Casino win shouldn't be treated as total gambling activity |
| Investor question | Is digital growth offsetting retail softness? | Is online casino expansion durable across partners and operators? |
The two markets should be read together, not averaged. Great Britain helps identify saturation and channel migration. New Jersey helps identify how regulated online casino revenue scales within a state framework. Neither measure alone explains promotional costs, player concentration or downstream financial harm.
The Channelization Problem After Legalization
Legalization can expand licensed supply without moving all consumer demand into regulated operators. Channelization measures the share of consumer spend captured by licensed businesses rather than offshore or unlicensed alternatives. Leakage persists when offshore brands retain payment access, search visibility or customer loyalty, including where consumers can still find operators outside the local licensing system. The overview of PAGCOR gambling advertising rules illustrates why advertising controls and discoverability matter to channelization.
A 2026 systematic review of legalization studies reported increased participation and gambling-related harm, alongside limited migration of existing offshore players into regulated channels. The systematic review and related legalisation research therefore supports a wider market scorecard. Licensing may produce measurable fiscal benefits while leaving illegal-market activity in place, so analysts should track channelization, consumer protection, harm-data quality and enforcement consistency together.
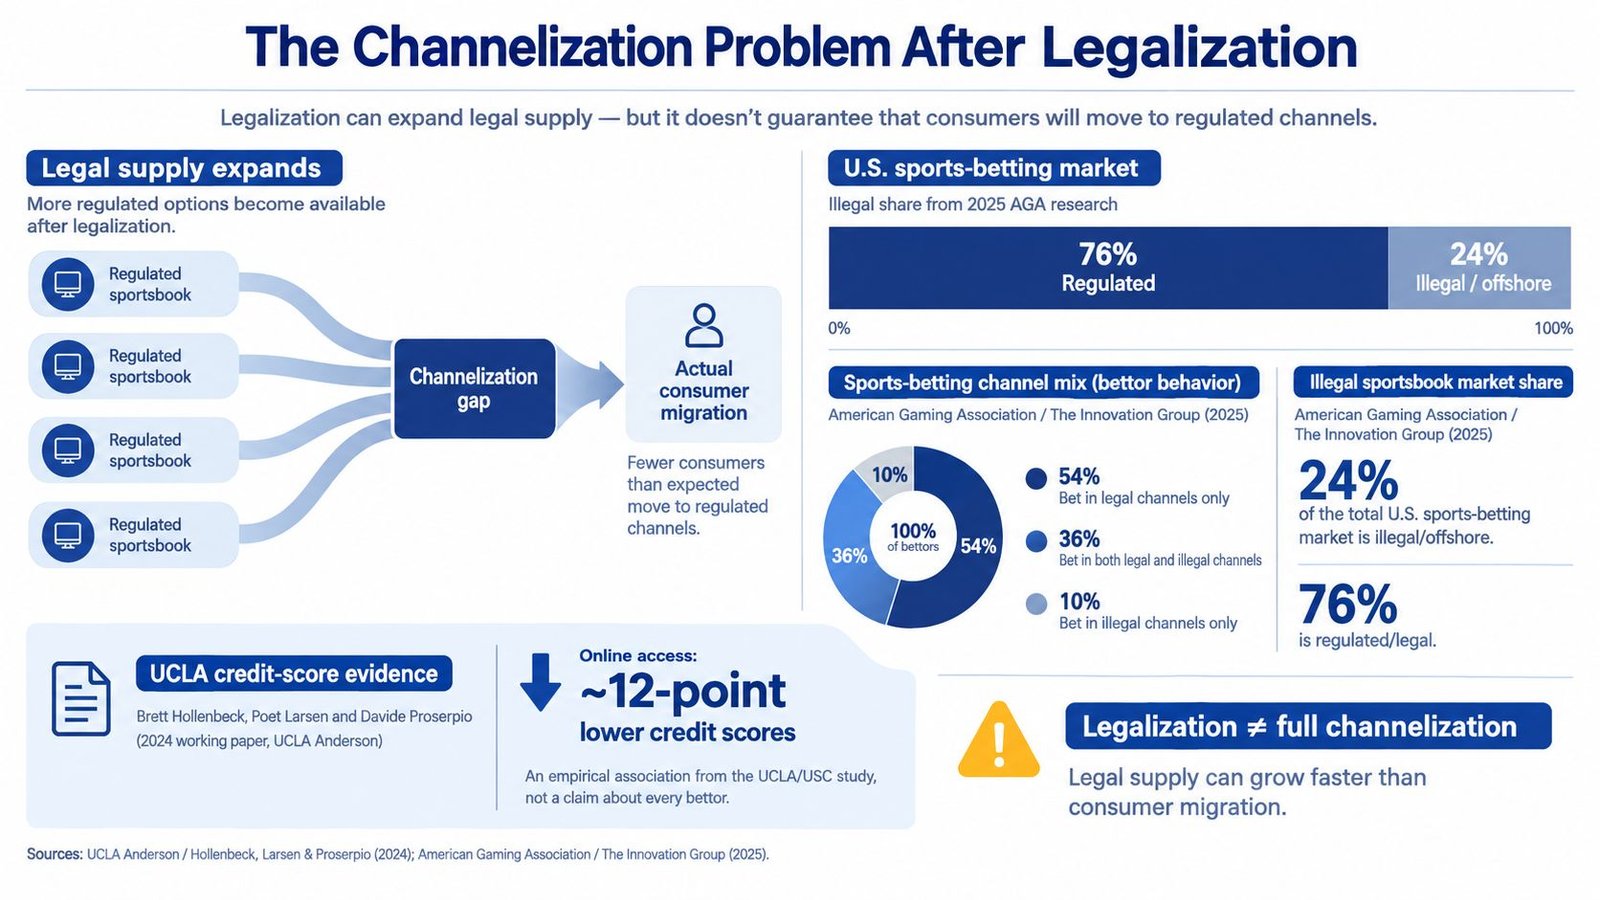
Revenue growth can hide balance-sheet stress
The UCLA Anderson research found that states introducing legal sports gambling experienced an average credit-score decline of about 0.8 points. Where online sports betting became available, the decline was nearly three times larger, at approximately 2.75 points. The finding is not a universal forecast, but it gives investors a reason to test GGR against household financial outcomes.
The distribution of losses matters as much as the market total. After online-gambling legalization, gambling expenditure increased more among the lowest-income third of earners than among the highest-income third. Commercial expansion can therefore coincide with greater loss concentration among households least able to absorb it.
Practical rule: A legalization case should include credit stress, missed payments, overdrafts, affordability signals and offshore migration, not just tax receipts and licensed accounts.
Online Slots Stake Rules Ceilings
Great Britain's online-slots limits show how a rule aimed at player protection becomes a product, data and technology requirement. From 9 April 2025, customers aged 25 and over faced a £5 maximum stake per online-slots game cycle. From 21 May 2025, customers aged 18 to 24 faced a £2 maximum. The limits apply to online slots, not roulette or blackjack. The Gambling Commission's online-slots stake guidance defines the relevant product and age distinction.
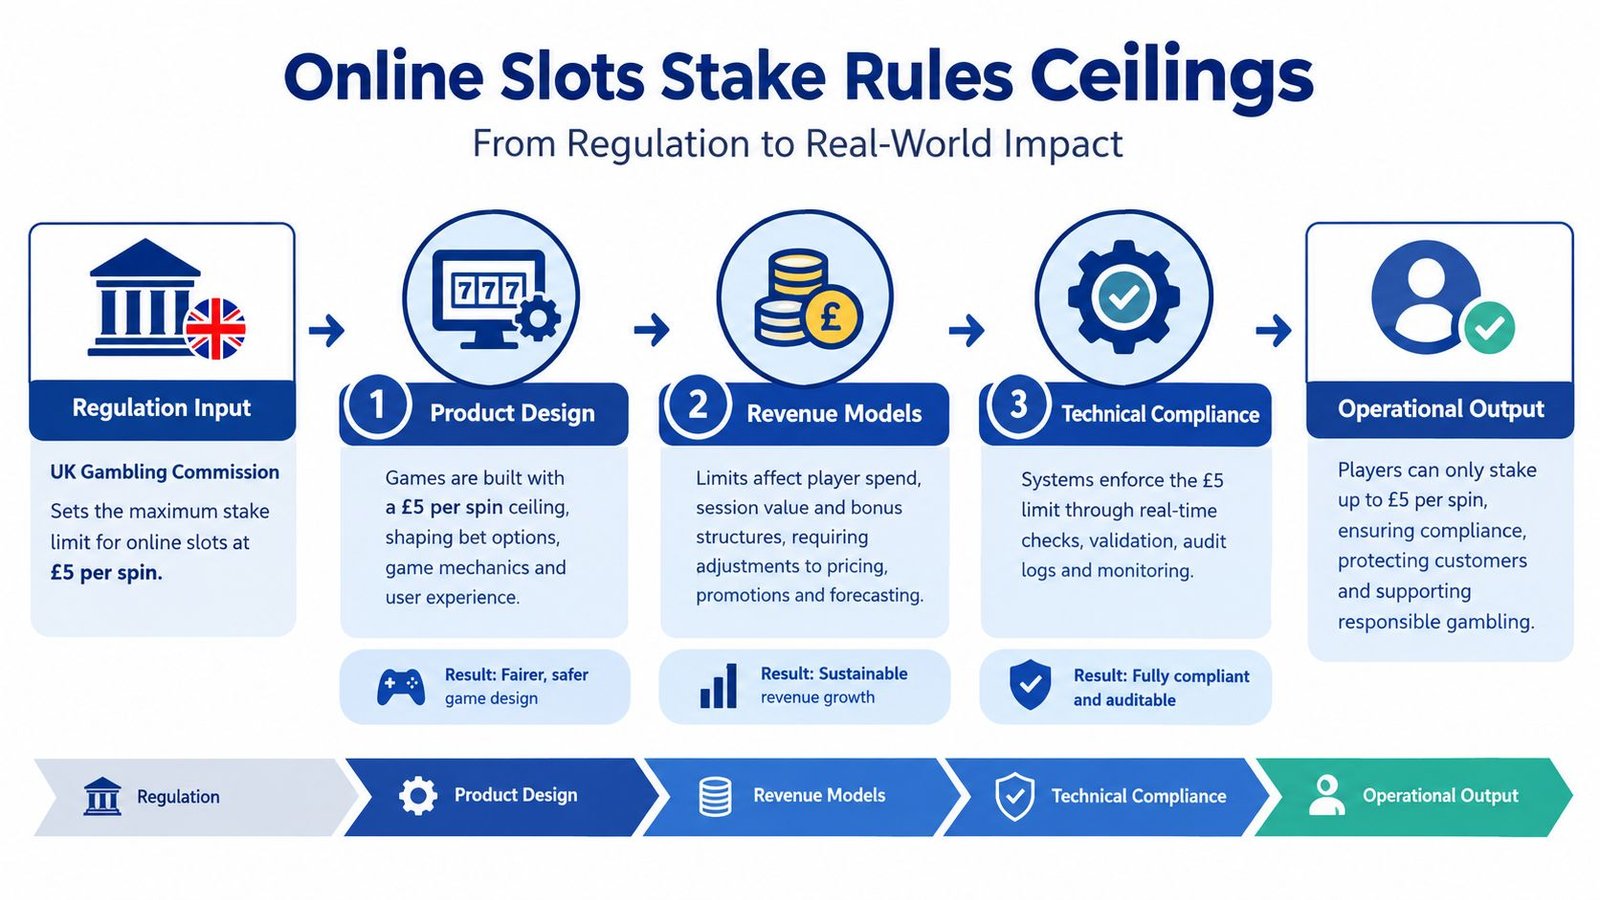
Three consequences for operators
Product design must distinguish qualifying slots from other remote casino content. Game portfolios with different volatility, paytable structures and player experiences may no longer produce the same commercial outcome when higher stakes are unavailable to defined age groups.
Revenue modelling should avoid unsupported assumptions about the direction or size of revenue drag. A lower permitted stake can compress average wager size, alter session behaviour and change the contribution of high-value customers, but the effect depends on player elasticity, game selection and substitution into other products. Operator estimates should be tested game by game, not applied as a portfolio-wide average without evidence.
Technical compliance begins at the wager stage. Operators need reliable age identification, correct classification of each game cycle and a system capable of applying the relevant ceiling in real time. Testing, audit trails and platform controls matter as much as the written rule. A broader guide to legal online casino markets in the Philippines provides a useful reminder that product legality and technical compliance are jurisdiction-specific questions.
The rule also creates a strategic choice. Operators can accept lower permitted stakes, redesign customer journeys or encourage substitution toward products outside the slots definition, subject to applicable rules. Regulators will judge those responses through the effect on risk, not through revenue preservation alone.
Are Responsible Gambling Controls Actually Working
Responsible-gambling controls perform two different jobs, and operators often blur them. Identification detects signals such as rapid deposits, unusual loss patterns or repeated limit changes. Reduction requires the customer's subsequent behaviour to change, with lower financial harm and no unacceptable migration to unlicensed sites.
This distinction changes the evaluation framework. A deposit-limit prompt may identify a risk event, but the number of prompts issued says little about whether spending fell, essential payments were protected or the customer opened another account. A self-exclusion system may work at the operator level while failing to prevent migration between brands if identity controls and cross-operator enforcement remain weak.
Recent research associates exposure to online gambling advertising with problem gambling and a greater likelihood of debt enforcement. The same evidence found greater experienced harm among users of offshore sites. In a separate 2025 study, 51.7% of participants said at least one financial product or service contributed to their gambling-related harm, while 75.9% of people affected by another person's gambling experienced at least one financial harm. The research on gambling, advertising and financial harm supports outcome-based evaluation rather than compliance-count reporting.
| Control Type | Identification Precision | Behavior Change Post-Intervention | Offshore Migration Risk |
|---|---|---|---|
| Deposit limits | Strong for limit breaches, weaker for undeclared external spending | Must be tested through later deposit and loss behaviour | Possible if controls are abrupt or fragmented |
| Affordability signals | Depends on data quality and customer context | Requires support that addresses financial difficulty | Material if licensed access becomes less usable without enforcement |
| Time-outs and self-exclusion | Clear for activity on the participating platform | Requires evidence of sustained exclusion and reduced harm | Higher where customers can move between operators |
| Safer-gambling messages | Broad reach, limited precision by themselves | Requires behavioural testing, not impression counts | Usually indirect, but depends on alternative access |
The correct benchmark is a counterfactual. Regulators and operators should compare outcomes with what would have happened without the intervention, then track precision, persistence and net migration. A control that identifies more people but produces no reduction in debt escalation hasn't demonstrated harm reduction.
A Practical Analyst Checklist for Any Market
A jurisdiction review should end with a repeatable evidence process rather than a market-size slogan. Analysts can use five layers, each linked to a question that commercial data alone can't answer.
Market sizing: Separate GGY, GGR, NGR, taxable yield and channel splits. The question is whether the market estimate includes lotteries, offshore activity or non-comparable products.
Operator KPIs: Review active customers, average revenue per user, bet frequency, hold margin and product mix by vertical. The question is whether reported growth comes from more customers, more activity, higher yield or a narrower high-value cohort.
Regulatory inputs: Map licensing costs, tax treatment, advertising restrictions, product limits, identity requirements and intervention rules. The question is whether the current margin structure survives the next compliance change.
Consumer-finance indicators: Track credit stress, disposable income, missed payments, overdrafts and payment-rail friction. The question is whether commercial expansion is transferring costs to households that market-level GGR doesn't show.
Channelization and harm signals: Monitor offshore-brand search interest, self-exclusion registrations, helpline demand, intervention outcomes and enforcement activity. The question is whether stricter licensed-market controls reduce harm or relocate activity.
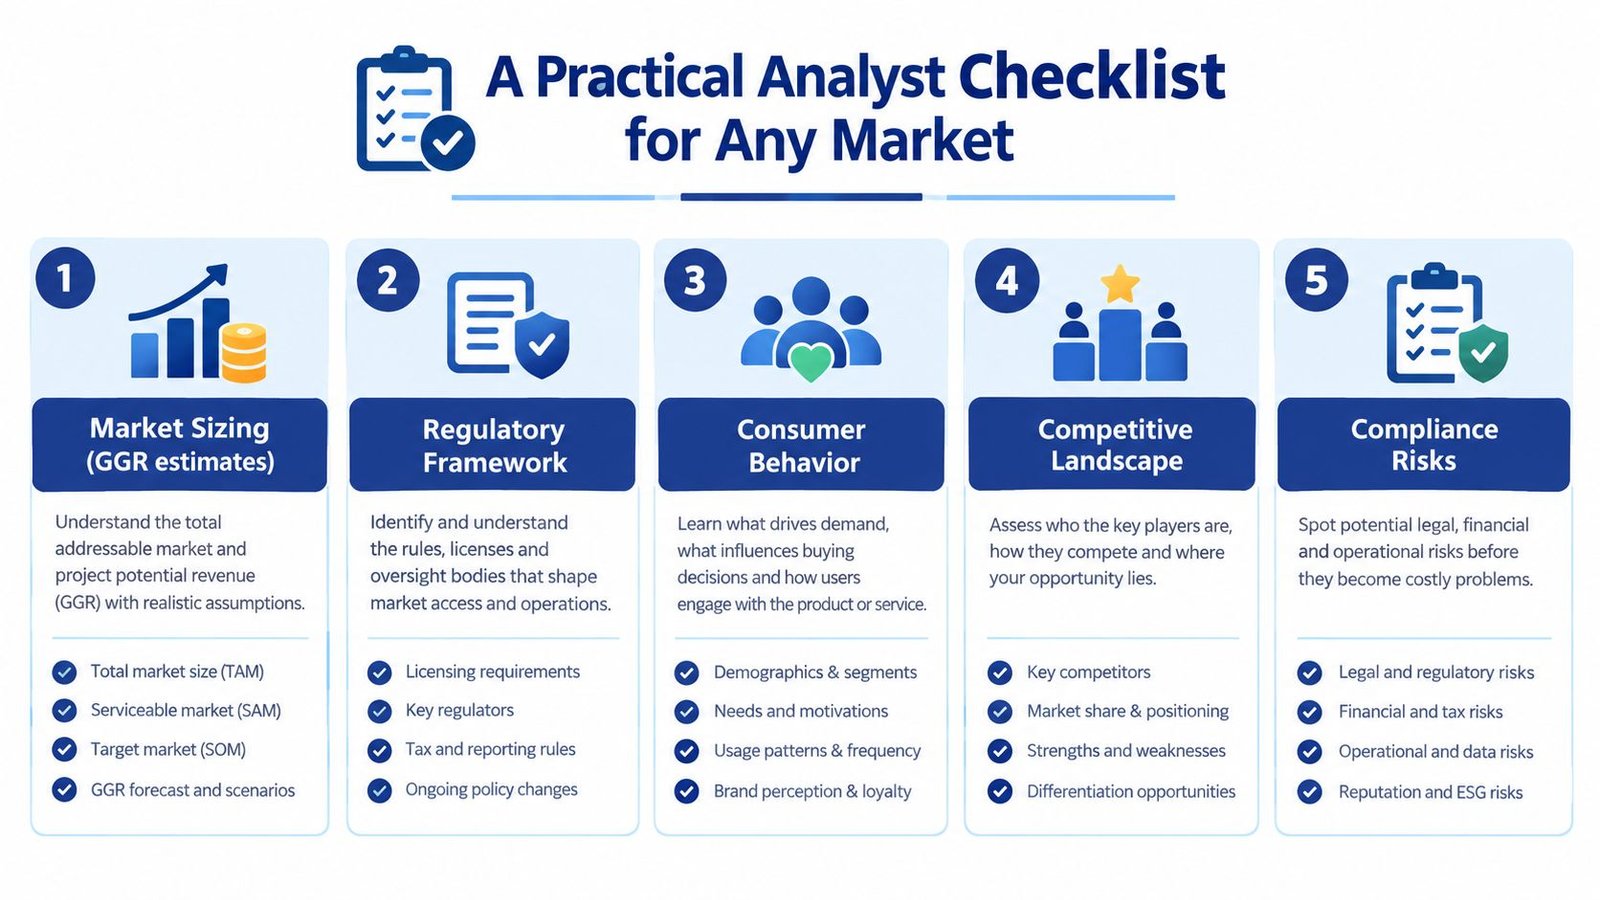
The strongest model links each commercial KPI to a risk indicator. Slots GGY should sit beside stake exposure and player concentration. Online expansion should sit beside channelization and credit outcomes. Acquisition efficiency should sit beside retention and intervention results.
Decision standard: A market is investable when revenue quality, regulatory durability and consumer outcomes can be explained together.
That standard also improves M&A analysis. A target with attractive NGR but concentrated exposure to one product, one jurisdiction or one high-risk cohort may deserve a different valuation from a diversified operator with slower but broader growth. The numbers don't remove judgement, but they make the judgement auditable.
For independent coverage of global iGaming news, regulation, market research, operator performance and responsible gambling, follow Top 1 Rank, the global iGaming intelligence publication. Its analysis helps operators, investors, suppliers, affiliates and regulators assess commercial opportunity alongside the compliance and consumer-finance risks that headline growth figures can conceal.





Join thousands of gaming professionals receiving the latest iGaming news, regulatory updates, and market insights.
