

PAGCOR's quarterly GGR series moved from Php81.70 billion in Q1 2024 to Php106.79 billion in Q4 2024, producing full-year GGR of Php372.33 billion, then continued upward through PHP110.63 billion in Q2 2025. The sequence provides a clear walkthrough of Philippine gaming's scale, pace, and changing revenue mix.
That trajectory looks straightforward until the segment tables are examined. Electronic gaming has become a major force inside the aggregate, while licensed casino performance can move in the opposite direction. For operators, investors, suppliers, and regulators, PAGCOR GGR data by quarter is therefore more useful than an annual headline because it shows when growth accelerated, which channels carried it, and where the underlying business became less broad-based.
Table of Contents
- Why PAGCOR's Quarterly GGR Series Matters
- How PAGCOR Defines and Reports GGR
- Quarterly GGR Data for 2024
- Quarterly GGR Data for 2025 So Far
- Segment Breakdown Inside the Headline Numbers
- Reading the 3Q 2025 Release and What It Reveals
- The Mix Shift Hidden Under Headline Growth
- Primary Sources, Methodology, and Downloadable Data
- Calculating YoY and QoQ Growth From the Series
- Actionable Takeaways for Operators and Investors
- Quick Reference Card and Cross-References
Why PAGCOR's Quarterly GGR Series Matters
PAGCOR's official releases show a market that repeatedly established higher quarterly benchmarks during 2024. GGR rose from Php81.70 billion in Q1 to Php89.23 billion in Q2, Php94.61 billion in Q3, and Php106.79 billion in Q4, before reaching PHP104.12 billion in Q1 2025 and PHP110.63 billion in Q2 2025. The 2024 quarterly totals and the first two 2025 figures are documented in PAGCOR's official industry-data publications.
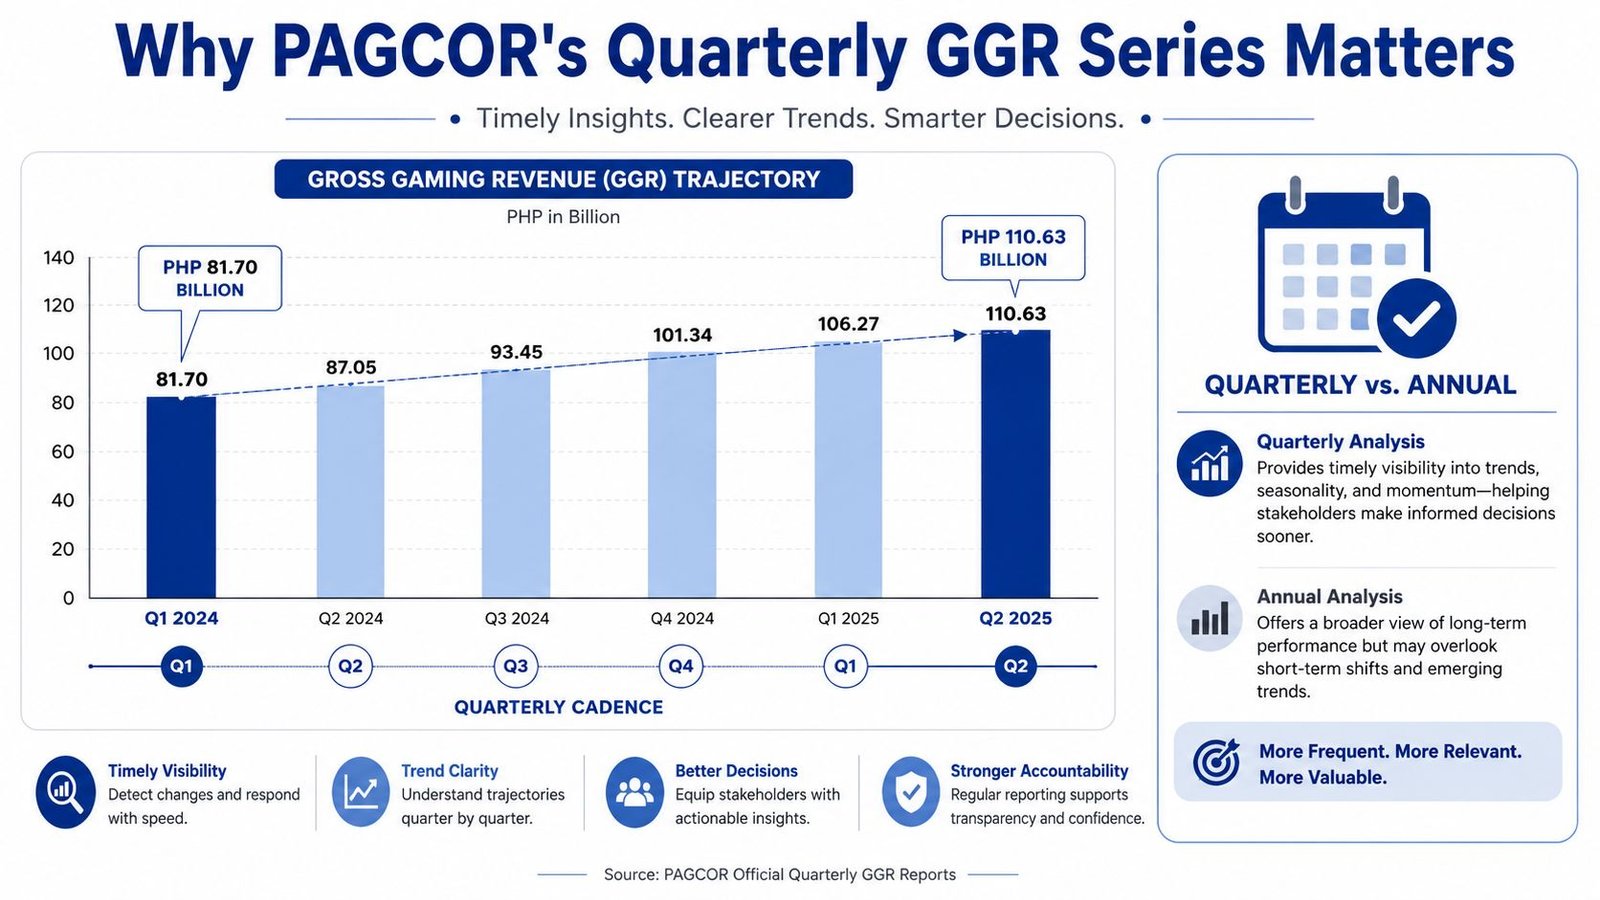
The quarterly cadence matters because an annual total smooths out the turning points that influence commercial decisions. A full-year number can confirm that the market expanded, but it can't show whether expansion was steady, concentrated in one quarter, or powered by a particular channel. The 2024 series answers those questions directly: every quarter exceeded the prior quarter, with Q4 becoming the first quarterly result above Php100 billion.
What the quarterly view reveals
For an operator assessing a new venue, a supplier estimating addressable demand, or an investor evaluating exposure, the quarterly series provides three practical signals:
- Trend visibility: successive quarterly totals show whether momentum is building or fading.
- Segment composition: PAGCOR separates PAGCOR-operated casinos, licensed casinos, and electronic gaming in its industry datasets.
- Comparable measurement: the same regulator reports the total market and its principal channels, reducing the risk of comparing unrelated revenue definitions.
The quarterly view also makes regulatory and distribution changes easier to detect. A rising aggregate can reflect stronger demand across venues, but it can also reflect substitution from physical casinos into electronic channels. That distinction affects property investment, platform capacity, payment infrastructure, compliance staffing, and supplier strategy.
Analyst reading rule: A higher quarterly GGR total answers whether the market expanded. The segment split answers what actually expanded.
PAGCOR's quarterly disclosures are especially useful because they combine headline totals with channel detail. The result is not merely a revenue timeline. It is a way to test whether Philippine gaming growth is broad-based, digitally concentrated, or changing in composition.
How PAGCOR Defines and Reports GGR
Gross gaming revenue, or GGR, is the industry's gaming revenue measure before operator-level deductions. In practical terms, it represents wagers after player winnings are removed. It isn't the same as profit, cash flow, license-fee collections, or the amount retained by PAGCOR.
PAGCOR's public reporting should be read through three separate layers:
- Industry GGR: the consolidated gaming revenue generated across the regulated Philippine market.
- License-fee collections: a fiscal stream received by PAGCOR under applicable arrangements. This isn't interchangeable with total industry GGR.
- Segment GGR: revenue allocated across PAGCOR-operated casinos, licensed casinos, electronic games, and other regulated categories reported in the relevant dataset.
That separation prevents one of the most common errors in market commentary. A headline referring to “PAGCOR revenue” may concern fees collected by the regulator, while a headline referring to Philippine gaming GGR concerns the revenue generated by the industry. The two measures answer different questions and shouldn't share a chart axis without explicit labeling.
A practical reading sequence
Analysts can reduce confusion by checking the document title and table labels before copying a number into a model. The first question is whether the figure is industry GGR, a PAGCOR fiscal receipt, or a segment result. The second is whether the period is monthly, quarterly, or annual. The third is whether the release includes restated prior-period figures.
Readers reviewing the domestic online market can also consult this overview of Philippine online casinos under PAGCOR, but the official PAGCOR industry-data files remain the reference point for the consolidated quarterly series. A market-sizing model should preserve the regulator's terminology rather than merging industry revenue with regulatory income.
Quarterly GGR Data for 2024
The 2024 series reached Php372.33 billion in full-year GGR, up 30.52% from Php285.27 billion in 2023, according to the official 2024 industry dataset. It provides the reference point for comparing the quarterly records reported afterward.
| Quarter | GGR (PHP billions) | Verified QoQ change |
|---|---|---|
| Q1 2024 | Php81.70 | Baseline |
| Q2 2024 | Php89.23 | 9.21% |
| Q3 2024 | Php94.61 | 6.02% |
| Q4 2024 | Php106.79 | 12.89% |
| Full year 2024 | Php372.33 | Not applicable |
Each quarter exceeded the previous one. Q2 added 9.21% over Q1, Q3 rose 6.02% from Q2, and Q4 advanced 12.89% from Q3. The sequence points to sustained expansion rather than a year-end result carrying the annual total.
Quarterly YoY comparisons and quarterly shares of the full-year total were not published in the verified source file, so the table retains only the reported GGR values and QoQ changes.
The Q3 signal
Electronic games were the clearest driver beneath the Q3 headline. They rose 464.38% year on year to Php35.71 billion, according to PAGCOR's quarterly disclosure. That increase changed the quarter's channel composition, showing that growth was tied not only to stronger overall demand but also to a substantial shift toward electronic gaming.
Q3 still reached Php94.61 billion, with the industry-data file recording the exact total as Php94,611,717,319.85. PAGCOR's accompanying material described it as the strongest quarterly performance at that point, and reported 37.52% year-on-year growth. Those headline figures matter, but the electronic-games result explains more about the market's underlying direction.
Q4 then reached Php106.79 billion, the strongest quarter of 2024 and the first above Php100 billion. The annual total establishes the market's scale, while the quarterly path and Q3 mix shift show how that scale was built. Future comparisons should therefore distinguish broad-based demand from continued substitution away from physical venues.
Quarterly GGR Data for 2025 So Far
PAGCOR reported PHP104.12 billion in Q1 2025 and PHP110.63 billion in Q2 2025. Q2 therefore set a new quarterly high, exceeding the Php106.79 billion recorded in Q4 2024. The sequence shows that 2025 growth was not confined to a year-end peak.
| Quarter | GGR (PHP billions) | Comparison |
|---|---|---|
| Q1 2025 | PHP104.12 | Above Q1 2024 |
| Q2 2025 | PHP110.63 | Above Q2 2024 |
The Q1 total comes from PAGCOR's 1Q 2025 industry-data release. The 2Q 2025 dataset records the higher Q2 result. The 2025 files provide the official quarterly totals used here, while the verified dataset does not provide the complete YoY percentage comparisons required for a calculated growth column.
Q2 increased by roughly 6.25% from Q1, based on the two reported totals. That pace was stronger than the average quarterly increase across 2024, calculated from the sequential changes reported earlier, which indicates acceleration rather than simple continuity. It also placed Q2 above the previous quarterly record, giving the first half of 2025 a higher operating base than the full-year series had established at the end of 2024.
The headline increase does not identify the source of that momentum. PAGCOR's later disclosures indicate that electronic gaming was offsetting weakness in brick-and-mortar casinos. Q1 and Q2 should therefore be read as periods of aggregate expansion with a changing segment mix, rather than as evidence that physical venues alone generated the higher totals.
Publication timing matters
The 3Q 2025 release is treated separately because it provides a later working snapshot with a reported total of PHP94,518,260,266.87. It does not revise the confirmed Q1 and Q2 reference points. A Q4 2025 figure should not be presented as available until PAGCOR publishes its full-year bulletin.
For comparisons, analysts should preserve the official Q1 total and avoid substituting figures from unrelated summaries. The quarterly series is most useful when its aggregate growth is paired with the land-based and electronic-game mix inside each period.
Segment Breakdown Inside the Headline Numbers
The PHP110.63 billion Q2 2025 total combines several operating channels, so it should not be read as one uniform demand signal. PAGCOR separates PAGCOR-operated casinos, licensed casinos, electronic games, bingo, and e-bingo. That classification lets analysts test whether quarterly growth came from wider venue demand or from substitution toward electronic channels.
The verified material does not provide complete Q1 and Q2 2025 amounts for every category. A full table of segment values, shares, and sequential changes would therefore imply precision the disclosures do not support. The usable comparison is narrower: licensed casinos fell 10.6% quarter on quarter to Php44.1 billion in Q2 2025, while online and electronic gaming offset declines in brick-and-mortar casinos, according to the official 2025 GGR release.
| Segment | Q1 2025 (PHP billions) | Q2 2025 (PHP billions) | QoQ Change |
|---|---|---|---|
| Licensed casinos | Not specified in the verified data | Php44.1 | -10.6% |
| Total industry GGR | PHP104.12 | PHP110.63 | Higher |
PAGCOR-operated casinos, electronic games, bingo, and e-bingo are not assigned verified Q1 and Q2 values in the available material. Their omission is a limitation of the evidence, not evidence that those channels were inactive.
Why the available split matters
The aggregate rose while licensed casinos contracted. That combination is consistent with substitution: electronic gaming and other categories contributed enough to offset the land-based decline. It does not establish that every channel grew, nor does it show how much of the increase came from electronic games without a complete segment reconciliation.
The 10.6% QoQ decline also changes how suppliers should interpret the quarter. For land-based equipment vendors, it signals weaker near-term demand at licensed casinos than the industry total suggests. For electronic-games platform and compliance providers, the offsetting contribution points to capacity and regulatory-support needs in a channel gaining relative importance. Those are directional implications, not a substitute for channel-level amounts.
Teams assessing market entry, accreditation, or distribution can consult this guide to PAGCOR game aggregator accreditation. The commercial reading remains specific: Q2 growth was not broad-based across the disclosed licensed-casino segment, and the headline total alone cannot identify the winning channel.
Reading the 3Q 2025 Release and What It Reveals
PAGCOR's 3Q 2025 industry dataset reports total Philippine GGR of PHP94,518,260,266.87. The official 3Q 2025 file breaks that quarter into monthly totals for July, August, and September and separates the results by PAGCOR-operated casinos, licensed casinos, and electronic gaming.
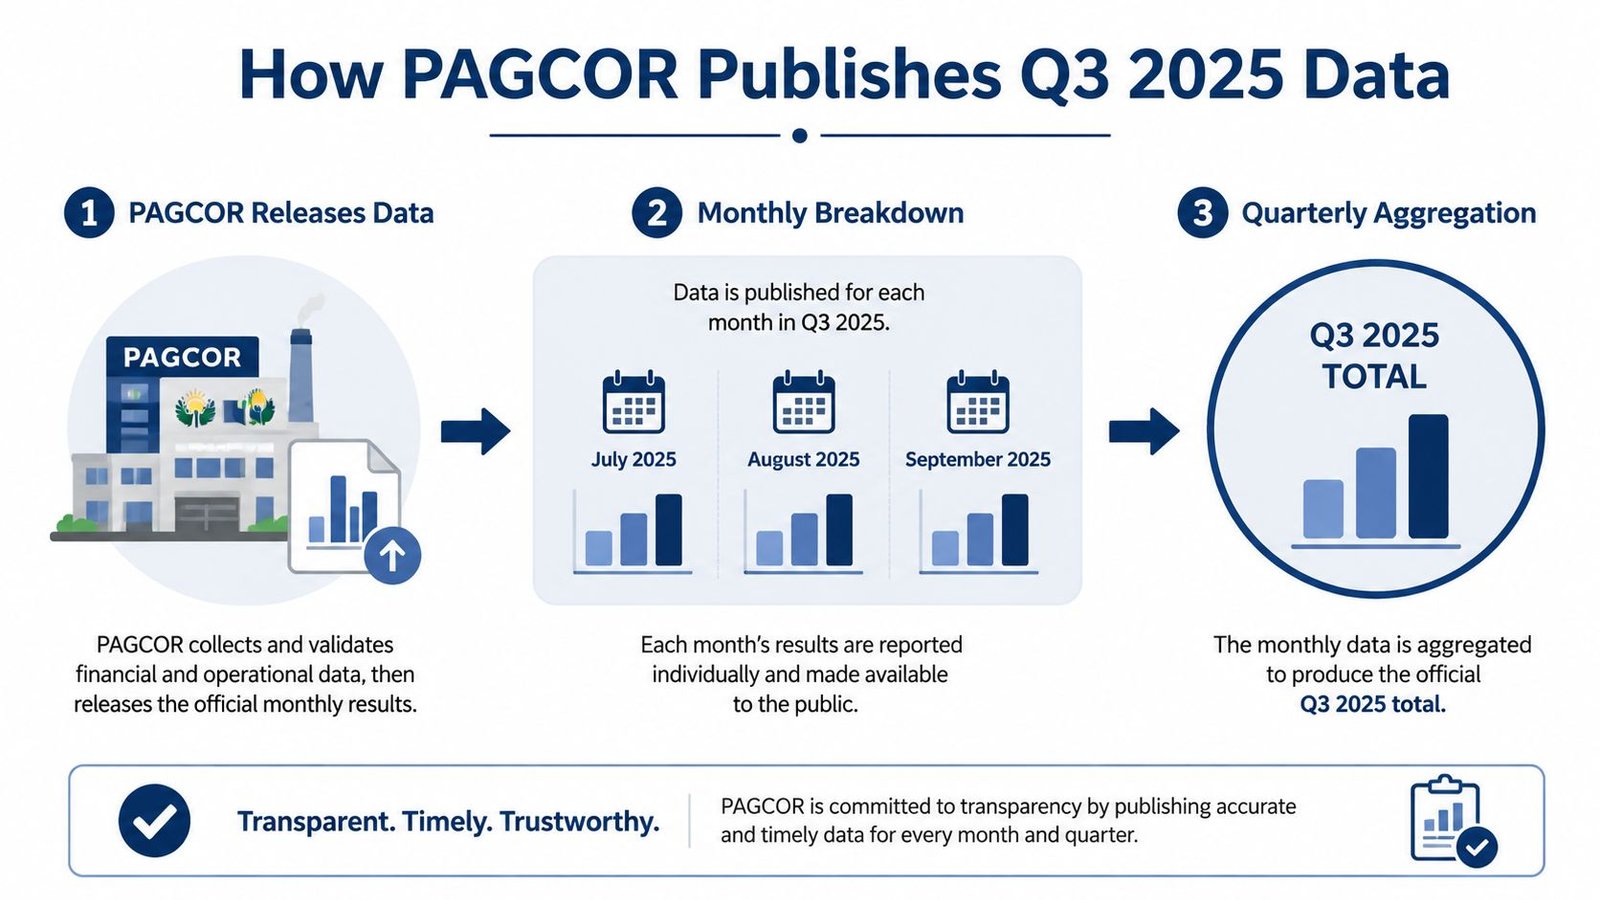
The most reliable reading order is simple:
- Confirm the headline total. This establishes the quarter's consolidated scale.
- Review the monthly rows. July, August, and September can reveal whether the quarter strengthened progressively or depended on one month.
- Check the segment table. The category split identifies the channels carrying the result.
- Compare the included prior-period fields. PAGCOR's file provides the structure needed for year-on-year and mix analysis.
What analysts should model
The release is more valuable than a quarter-end headline because it supports intra-quarter analysis. Monthly figures can help analysts test seasonality, while the segment breakdown can identify concentration risk. A quarter that appears resilient in total may still depend heavily on electronic gaming, leaving operators exposed to channel-specific regulatory or payment changes.
The 3Q 2025 figure is a working snapshot, not a terminal annual dataset. PAGCOR's later full-year publication may provide revised comparisons, restated figures, or a more complete view of segment performance. Models should preserve the original release and update the period when the annual bulletin becomes available.
The Mix Shift Hidden Under Headline Growth
Quarterly GGR can rise while the investment case for physical venues becomes less attractive. The PAGCOR series supports that distinction through two verified signals: electronic games rose 464.38% year on year to Php35.71 billion in Q3 2024, while licensed casinos recorded a 10.6% quarter-on-quarter decline to Php44.1 billion in Q2 2025.
| Quarter | Total GGR (PHP B) | YoY Total | Electronic Games YoY | Licensed Casino QoQ |
|---|---|---|---|---|
| Q3 2024 | Php94.61 | 37.52% | 464.38% | Not specified |
| Q2 2025 | PHP110.63 | Not specified | Not specified | -10.6% |
For capital allocation, the key question is whether a higher total reflects stronger demand across venues or a change in where wagering occurs. Q3 2024 is a useful stress test: electronic gaming contributed Php35.71 billion after its sharp year-on-year increase. That concentration changes how analysts should assess capacity, customer acquisition, and channel exposure.
Physical expansion should therefore be tested against property-level indicators rather than national GGR alone. Operators should review land-based revenue, visitor flows, table and slot performance, and local operating costs before approving additional floors or venues. Investors should also separate exposure to venue earnings from exposure to platform, content, payments, and compliance services.
The quarterly mix creates a second operational issue: different channels face different execution requirements. A land-based operator may prioritize occupancy, tourism demand, and property productivity. An electronic gaming business may prioritize distribution, technology, payment reliability, and compliant customer acquisition. The PAGCOR gambling advertising rules should be incorporated into that channel assessment, since digital marketing and distribution carry compliance considerations distinct from those of a physical venue.
Track land-based GGR as a share of total GGR each quarter, alongside the absolute land-based figure and total GGR growth. A falling share with a stable or declining physical segment points to substitution risk. A rising physical figure combined with broader segment growth offers stronger evidence for venue expansion. This metric gives operators and investors a direct test of whether headline growth is translating into physical demand.
Primary Sources, Methodology, and Downloadable Data
The strongest source hierarchy begins with PAGCOR's own publications. The regulator's Industry Data PDFs provide consolidated market totals and segment tables, while Insider bulletins can add monthly context. Quarterly and annual releases may also include prior-period comparisons that help analysts reconcile a model.
| Source | Cadence | Contents | Typical Lag |
|---|---|---|---|
| PAGCOR Industry Data PDF | Quarterly and annual | Industry GGR, monthly totals, segment breakdowns | Varies by release |
| PAGCOR Insider bulletin | Monthly or periodic | Monthly industry and venue information | Varies by bulletin |
| PAGCOR quarterly or annual release | Quarterly and annual | Headline GGR, comparisons, segment commentary | Varies by release |
The 2024 annual dataset is the primary source for the complete Q1 to Q4 series. The separate 1Q, 2Q, and 3Q 2025 files provide the later snapshots and preserve the segment structure needed for comparison. Citation practice should identify PAGCOR, the document title, the covered period, and the exact table or release date used in a chart.
Methodological controls
Three controls deserve priority:
- Preserve units: PAGCOR tables may present figures in PHP millions, while article summaries may use PHP billions. Conversion should be documented.
- Track reclassifications: segment definitions can change between releases, so a category shouldn't be treated as perfectly comparable without checking the table labels.
- Retain restatements: prior-period values may be revised. A model should store both the originally published figure and the later restated figure.
A tidy downloadable CSV can reconcile the official documents into one quarterly series with total GGR and segment columns. That format reduces manual re-keying from PDFs, but it shouldn't replace the original regulator files. Analysts need the source documents to verify definitions, revisions, and the scope of each category.
For ongoing monitoring, the PAGCOR regulatory updates archive can help teams locate later announcements, but every quantitative model should still cite the exact official industry-data file behind each observation.
Calculating YoY and QoQ Growth From the Series
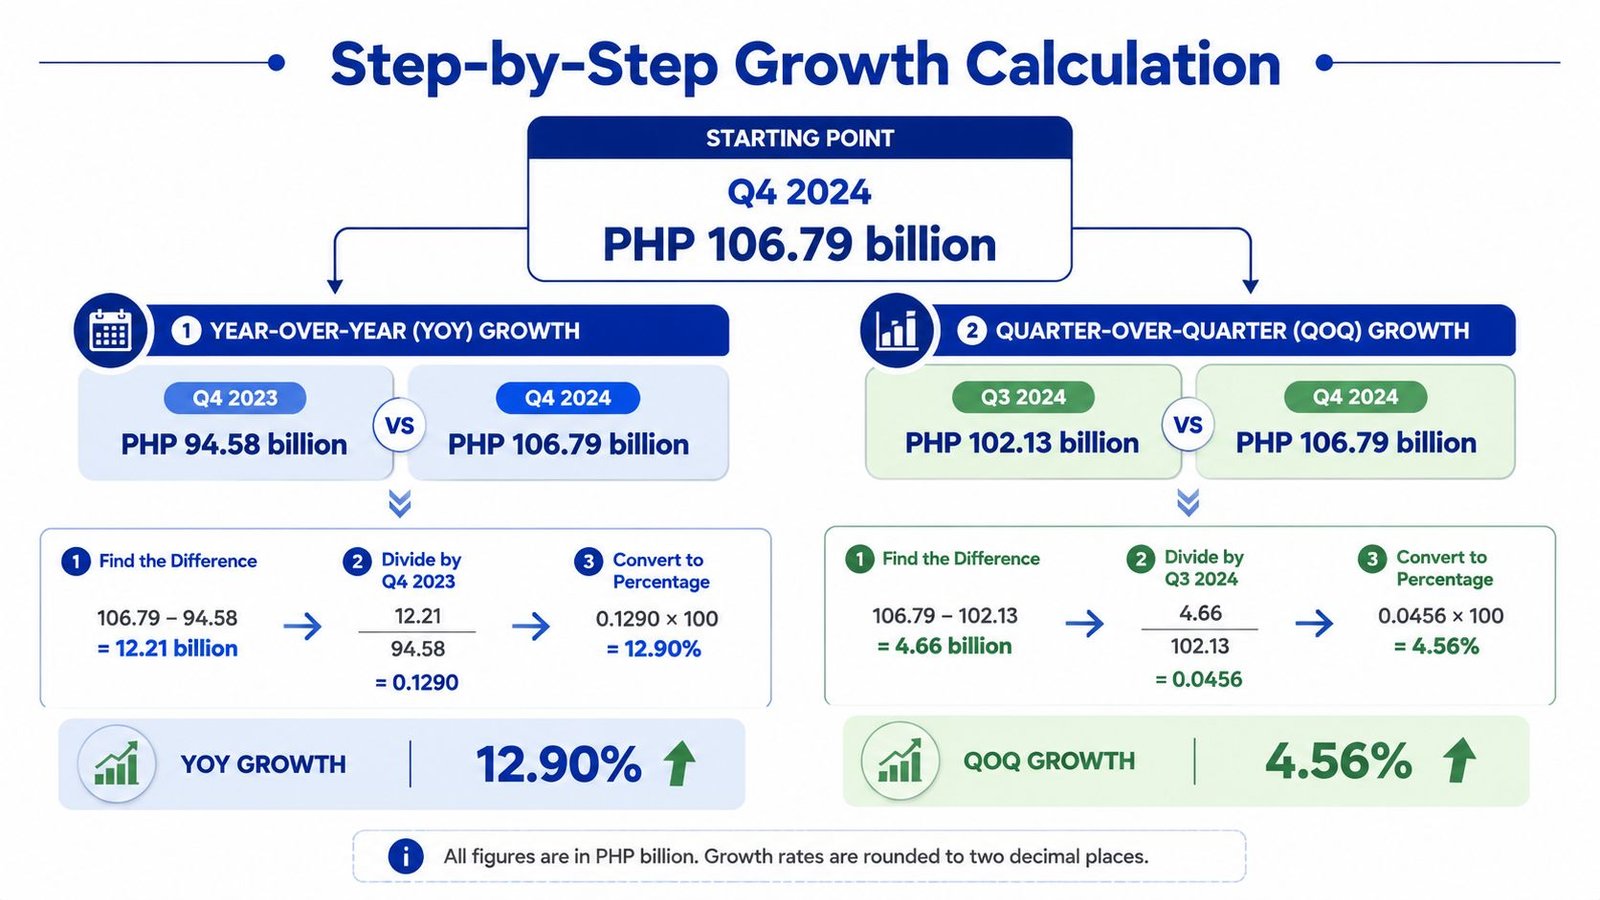
Quarter-on-quarter growth measures movement from the immediately preceding quarter:
QoQ growth = (current quarter GGR minus prior quarter GGR) ÷ prior quarter GGR
Year-on-year growth uses the same quarter in the previous year:
YoY growth = (current quarter GGR minus same quarter prior-year GGR) ÷ same quarter prior-year GGR
The Q4 2024 figure provides a clear starting point at Php106.79 billion. PAGCOR reports that Q4 was 12.89% higher than Q3 2024, so the quarter's QoQ change is already available in the official annual industry data. A Q4 year-on-year calculation requires the Q4 2023 comparator from the relevant PAGCOR release. Because that prior-quarter value isn't included in the verified data supplied here, an exact independently calculated Q4 2024 YoY percentage shouldn't be inserted into a model without retrieving the source comparator.
Why calculated rates can differ
Small methodological differences can change a reported growth rate:
- Rounding: a table may display PHP billions while the underlying file stores a more precise amount.
- Restatements: PAGCOR may revise an earlier period, changing the denominator.
- Reclassification: a segment may move between categories, affecting segment-level comparisons even when the consolidated total remains comparable.
Model control: Store the raw PAGCOR value, the displayed rounded value, the publication date, and any later restatement separately.
Before publishing a growth chart, analysts should confirm that both periods come from the same release family where possible. The calculation should then be checked against PAGCOR's own stated rate, with any difference explained by precision, revisions, or scope. That process is more reliable than copying a percentage from a secondary article without checking its denominator.
Actionable Takeaways for Operators and Investors
The quarterly series supports three decisions, provided operators separate total GGR from the segment generating it. Consolidated growth establishes market scale. The segment mix indicates where expansion, product investment, and risk controls should be directed.
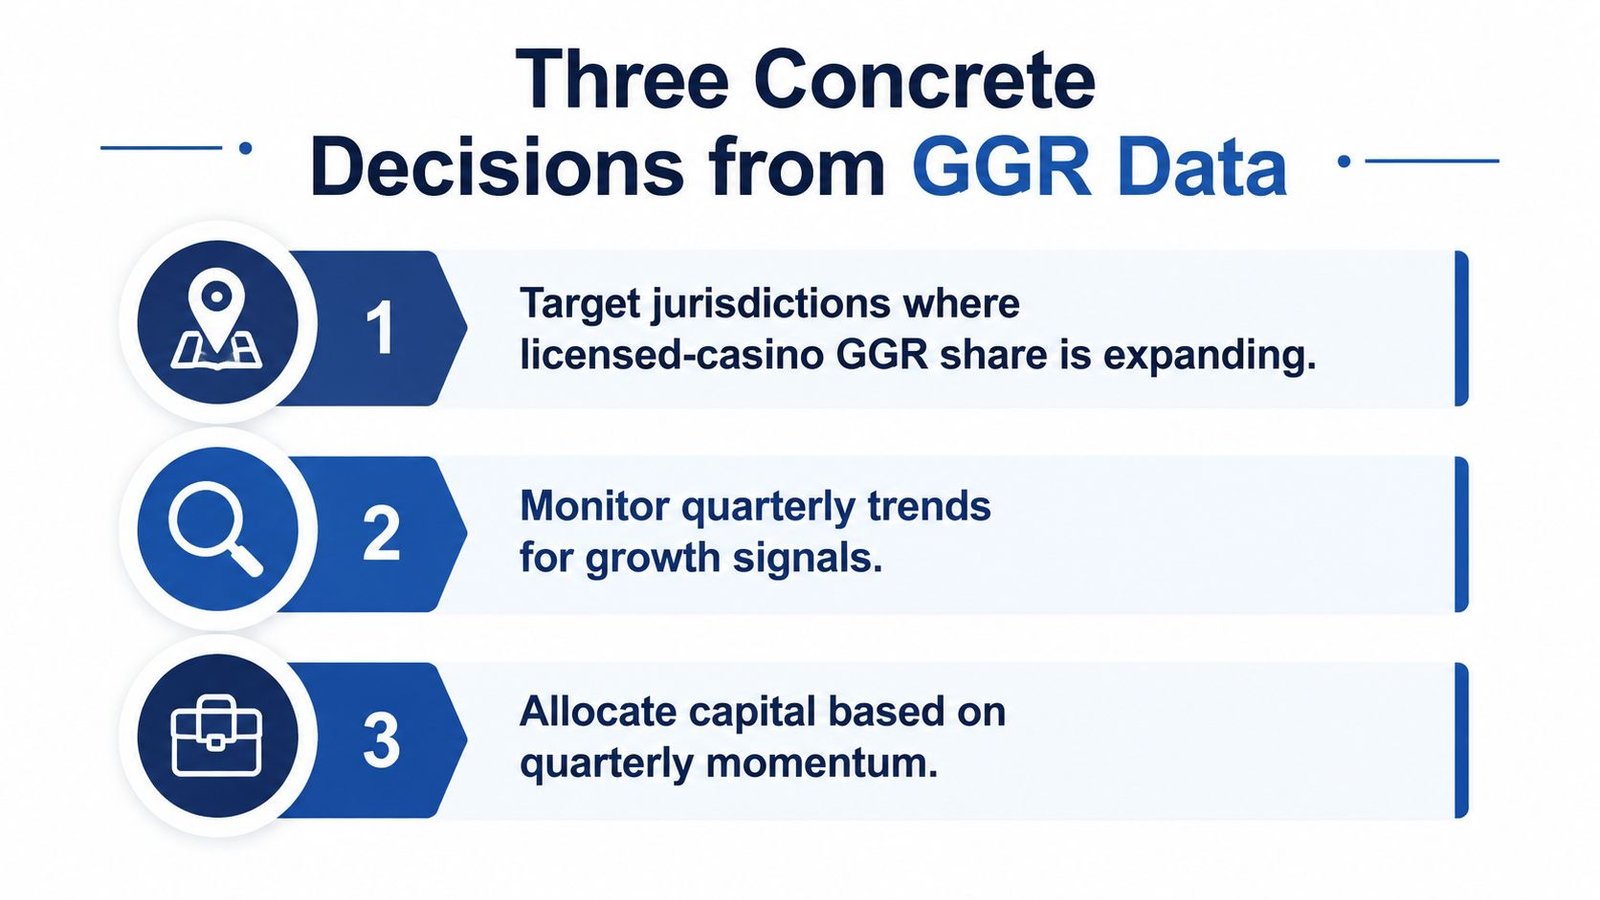
1. Prioritize the channel, not just the jurisdiction
The 2024 series shows quarterly expansion, yet the Q3 electronic-games result and later licensed-casino contraction weaken the case for treating national growth as proof of demand for another physical floor. Expansion plans should match the operating model to the segment producing incremental GGR.
A casino management-system supplier may find a different opportunity from a studio supplying electronic content. A payment provider, for example, could prioritise electronic-games integrations, settlement capacity, and transaction monitoring after the segment's 464.38% increase in Q3 2024, rather than allocate the same resources to a new land-based venue. Platform providers and compliance vendors should make the same channel-level assessment.
2. Separate demand from substitution
The 464.38% electronic-games increase in Q3 2024 and the 10.6% licensed-casino QoQ decline in Q2 2025 provide a stress test for investment assumptions. Electronic gaming can offset physical weakness while leaving demand uneven across venue types.
That distinction changes forecasts for table games, slots, hospitality, retail traffic, platform capacity, fraud controls, and customer support. Teams assessing market entry can consult the PAGCOR B2B provider application process while evaluating segment exposure separately from licensing requirements.
3. Monitor on three timescales
Monthly bulletins indicate in-quarter direction. Quarterly Industry Data PDFs provide the fuller segment view, while annual releases support reconciliation and can reveal restatements affecting historical comparisons.
Keep the first publication instead of overwriting it. A revised annual figure may suit a final report, but the original remains the record of information available when the decision was made.
Next-quarter check: Compare the next PAGCOR quarterly Industry Data release's electronic-games and licensed-casino figures with the consolidated GGR change. Rising electronic games alongside continued licensed-casino weakness would support the substitution thesis. A concurrent recovery in licensed casinos would weaken it.
Quick Reference Card and Cross-References
The table below is designed as a lookup tool for the verified quarterly series available in the source material. The supplied data contains six distinct quarters from Q1 2024 through Q2 2025, not eight complete quarters. No unsupported figures have been added for periods that aren't documented.
| Quarter | Industry GGR (PHP Bn) | YoY Change | QoQ Change | Dominant Segment Driver |
|---|---|---|---|---|
| Q1 2024 | Php81.70 | Not specified | Baseline | Not specified |
| Q2 2024 | Php89.23 | Not specified | +9.21% | Not specified |
| Q3 2024 | Php94.61 | +37.52% | +6.02% | Electronic games signal |
| Q4 2024 | Php106.79 | Not specified | +12.89% | Not specified |
| Q1 2025 | PHP104.12 | Not specified | Not specified | Not specified |
| Q2 2025 | PHP110.63 | Not specified | Not specified | Electronic games offsetting licensed-casino weakness |
The Q1 to Q4 2024 figures and the reported quarterly changes come from PAGCOR's 2024 industry statistics file. The Q1 and Q2 2025 totals are drawn from PAGCOR's official first- and second-quarter files cited earlier. The Q3 2025 dataset should be treated as a separate working snapshot because its reported total is PHP94,518,260,266.87, and its monthly and segment fields require direct review before integration into a longer series.
Reference points for reproduction
Analysts reproducing the card should retain the official Industry Data PDFs, the PAGCOR Insider archive, and the annual dataset used for restated comparisons. The next quarterly disclosure should be added only after publication, with its monthly totals, segment labels, and any revised prior-period values preserved.
The methodology section above contains the controls for rounding, restatements, and reclassification. The segment section contains the warning that a higher total can coexist with weakness in licensed casinos. Those two checks should accompany every chart built from PAGCOR GGR data by quarter.
Top 1 Rank provides continuing iGaming intelligence for operators, investors, suppliers, affiliates, and regulatory professionals. Subscribe to Top 1 Rank's market-analysis coverage to track PAGCOR releases, segment shifts, licensing developments, and the quarterly signals that headline GGR figures leave out.





Join thousands of gaming professionals receiving the latest iGaming news, regulatory updates, and market insights.
