

The most defensible starting point for the Philippines sports betting market size 2026 isn't a sportsbook-only number. It's the tension between a projected USD 3,907 million online gambling market, a PAGCOR forecast of PHP 320 billion to PHP 350 billion for total 2026 gaming revenue, and a first-quarter result that fell year on year. Ken Research projects the online gambling market at USD 3,907 million in 2026, while PAGCOR figures reported by Philstar show PHP 87.6 billion in total gross gaming revenue in the first quarter of 2026.
That gap matters because sports betting is embedded within a broader digital gaming market. E-games, e-bingo, virtual betting, casino products, and live sports wagering don't always appear as separate lines in PAGCOR disclosures. Operators, affiliates, suppliers, and investors therefore need to treat the headline market-size question as a channel-mix and pricing problem, not as a hunt for one definitive figure.
Table of Contents
- Why the 2026 Philippines Sports Betting Number Is Hard to Pin Down
- From 2024 to 2026 A Revenue and Growth Baseline
- Online Mobile and Live Sports Inside the Channel Mix
- How PAGCOR's 2026 Fee Schedule Reshapes Sportsbook Economics
- Operator Landscape and Market Share Signals
- Growth Drivers and Headwinds for Sportsbook Demand
- Base Bull and Bear Scenarios for 2026
- What Operators Affiliates and Investors Should Do Next
Why the 2026 Philippines Sports Betting Number Is Hard to Pin Down
A single 2026 sportsbook figure can create false precision. Ken Research's estimate covers the Philippines online gambling market, not a clean, regulator-published live sportsbook total. The projection includes a USD 3,907 million 2026 market estimate, 11.7% projected year-on-year growth, and a rise to USD 6,793 million by 2031. It also models 9.0 million active wagering accounts and an 84% mobile transaction share, evidence of a large, mobile-led addressable market rather than proof that all projected revenue comes from sports betting.
PAGCOR uses a different measurement frame. Its official figures put national gross gaming revenue at PHP 396.14 billion in 2025, compared with PHP 372.33 billion in 2024, a 6.4% increase. The online and electronic segment contributed PHP 201.12 billion, slightly more than half of the national total. PAGCOR's reported 2025 and 2026 revenue figures provide the peso-denominated baseline.
Why currency conversion changes the answer
Ken Research reports in US dollars, while PAGCOR reports in pesos. The two series can't be compared mechanically without an exchange-rate assumption, and that assumption can move the apparent market size even when local wagering activity hasn't changed. A dollar figure is therefore useful for international comparisons, but a peso figure is more practical for licensing costs, guaranteed fees, payroll, marketing, and local operator planning.
The second issue is vertical bundling. PAGCOR-related reporting has shown online gaming as the largest revenue source, but disclosures don't consistently isolate PIGO sports betting from other licensed digital products. That means a publisher presenting the entire online segment as sportsbook revenue would overstate the sports opportunity.
Analyst view: The 2026 market should be expressed as a range with a confidence label, not as a sportsbook-only point estimate presented as regulator-certified fact.
For decision-making, the better question is how much of the digital pool comes from live sports, virtual betting, e-games, and e-bingo, and how those products perform after PAGCOR fees. Readers evaluating legal online casino options in the Philippines should apply the same distinction. A platform's digital revenue doesn't automatically reveal its sportsbook exposure.
From 2024 to 2026 A Revenue and Growth Baseline
PAGCOR's published baseline describes a market that expanded in 2025 but entered 2026 under pressure. National GGR rose from PHP 372.33 billion in 2024 to PHP 396.14 billion in 2025, representing 6.4% year-on-year growth. That increase supports the conclusion that the regulated gaming ecosystem remained substantial, but it doesn't establish that sports betting grew at the same pace.
The first quarter of 2026 changed the tone. PAGCOR reported PHP 87.6 billion in total GGR, down 16% year on year from the comparable period. The electronic gaming segment generated PHP 39.90 billion, down 22.4% year on year. PAGCOR Chairman Alejandro Tengco separately indicated that full-year 2026 industry GGR could fall within PHP 320 billion to PHP 350 billion, a range below the 2025 result. These figures are documented in PAGCOR's revenue disclosure and industry guidance covered by Philstar.
The baseline in one view
The table below separates reported figures from an important limitation. The “implied sports betting GGR” cells are not PAGCOR-reported sportsbook totals. They are analytical placeholders and should not be treated as verified market measurements.
| Period | Total PAGCOR GGR (PHP B) | YoY Change | Online GGR (PHP B) | Implied Sports Betting GGR (PHP B) |
|---|---|---|---|---|
| 2024 | 372.33 | Not stated in the cited baseline | Not separately stated | Not disclosed |
| 2025 | 396.14 | 6.4% | 201.12 online and electronic segment | Not separately disclosed |
| Q1 2026 | 87.6 | Down 16% year on year | 39.90 electronic segment | Not separately disclosed |
| Full-year 2026 projection | 320 to 350 | Not a single growth rate | Not separately stated | Not disclosed |
The historical pattern has two simultaneous signals. First, digital wagering has become structurally important, with the online and electronic segment accounting for slightly more than half of 2025 national GGR. Second, the latest quarterly decline shows that digital scale doesn't guarantee uninterrupted expansion.
Why CAGR is a weak shortcut here
A conventional CAGR calculation would require comparable sportsbook-only revenue for each period. That series isn't supplied by PAGCOR in the cited disclosures. Applying the 6.4% national GGR growth rate to sports betting would assume that the sportsbook channel mirrors the entire market, an assumption that the available data doesn't support.
For operators, the practical baseline is therefore a reported national market, a separately reported digital segment, and a sportsbook contribution that requires internal disclosure or carefully bounded modeling. This is less tidy than a single CAGR, but it is more useful for budgeting.
Online Mobile and Live Sports Inside the Channel Mix
Mobile behavior and online revenue establish distribution reach, not sportsbook size. Ken Research's 2026 estimate assigns 84% of transactions to mobile, while PAGCOR-related reporting places online gaming at 53.5% of total GGR in the first half of 2025. The H1 2025 market-share coverage distinguishes online gaming from land-based revenue.
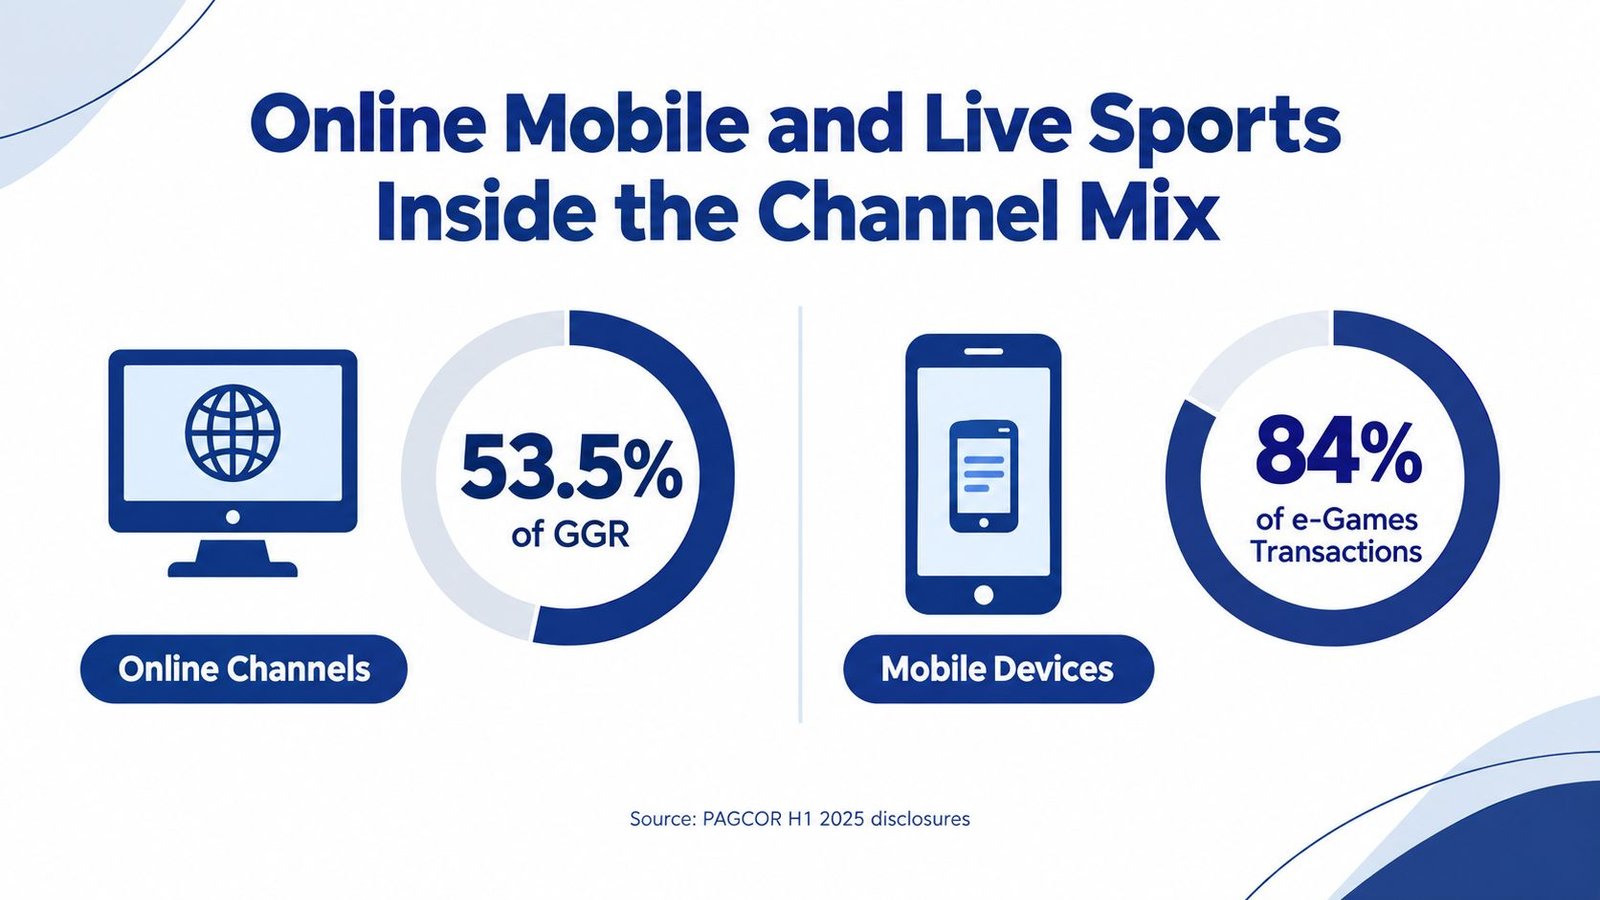
The commercial signal is clear: customer acquisition, deposits, and wagering increasingly occur through digital accounts and phones. The 84% mobile share describes transactions across the broader online gambling market, not sportsbook GGR. It therefore supports a mobile distribution thesis rather than a precise sports-betting forecast. Live betting is particularly compatible with this channel because odds change quickly and users need immediate access to balances and markets.
Four layers that require separate measurement
Online versus retail identifies distribution. Mobile versus desktop identifies the access device. Live versus pre-match identifies the betting format. Sportsbook versus virtual and e-games identifies the product. These are different dimensions, so adding their shares can count the same activity more than once.
Product classification also affects pricing. Live sports betting carries a 15% GGR share, whereas virtual betting remains at 30%, according to PAGCOR's January 2026 sports-betting fee reporting. A digital account can therefore generate revenue with very different regulatory costs depending on what the customer plays. Channel mix and product mix must be modeled together, especially when estimating sportsbook contribution to bundled online GGR.
Basketball and football rank among the leading sports of interest in surveyed-player coverage, and traditional sports betting was reported as the most popular gambling product, with 50% usage in the cited independent research. The market coverage on young mobile betting behavior outlines this demand profile. These findings indicate demand for sportsbook discovery, but they do not convert total online gambling revenue into verified sportsbook GGR.
For affiliates and suppliers, the operating question is attribution. Mobile reach can bring users into a sportsbook, yet retention and revenue-share value depend on whether those users prefer live sports, pre-match markets, virtual betting, or other e-games. Sport-specific content, such as MPBL betting odds information, can support acquisition, but performance reporting should connect each visit to product, deposit, and wagering outcomes.
How PAGCOR's 2026 Fee Schedule Reshapes Sportsbook Economics
PAGCOR's January 2026 fee schedule changes sportsbook economics more directly than a single market-size estimate can. The regulator reduced the live sports betting GGR share to 15% from 17.5%, while virtual betting remains at 30%. The revised rates applied retroactively to the November 2025 billing period, according to PAGCOR's published sports-betting rate update.
The lower live-betting share reduces the variable regulatory cost attached to that revenue stream. Its value depends on scale, however, because fixed monthly obligations can outweigh the saving for smaller operators. The relevant question is therefore contribution after both fee types, not the headline rate alone.
The fixed-cost hurdle
For non-casino operators, PAGCOR set a minimum monthly GGR benchmark of PHP 15 million and a PHP 3 million minimum guaranteed fee. From 1 October 2026, the benchmark will rise to PHP 20 million and the minimum guaranteed fee will rise to PHP 4 million. The Q1 2026 fee disclosure details the benchmark and minimum guaranteed fee schedule. Operators should also track PAGCOR regulatory updates for 2026 as the scheduled change approaches.
| Fee component | Pre-2026 rate | 2026 rate | Impact on margin |
|---|---|---|---|
| Live sports betting GGR share | 17.5% | 15% | Lower variable fee on live sports GGR |
| Virtual betting GGR share | 30% | 30% | No rate relief |
| Minimum monthly GGR benchmark | PHP 15 million | PHP 15 million, rising to PHP 20 million on 1 October 2026 | Higher volume hurdle from October |
| Minimum guaranteed fee | PHP 3 million | PHP 3 million, rising to PHP 4 million on 1 October 2026 | Higher fixed cash commitment from October |
The schedule produces two distinct economics. A sportsbook that clears the benchmark consistently can retain more of its live-betting GGR after the variable fee reduction. A sub-scale licensee may still owe the minimum even when customer activity does not generate enough GGR to support that fixed commitment.
Practical rule: Model a live-betting rate cut alongside the minimum guarantee, never in isolation.
Virtual betting remains subject to 30%, twice the live sports rate. That difference affects product allocation, although virtual products can still fill gaps between fixtures and maintain wagering activity. Their role should be assessed using contribution after regulatory fees, incentives, technology, payment costs, and acquisition spend.
The October step-up makes monthly forecasting more demanding. Operators should test weak months, seasonal sports calendars, and acquisition pauses before expanding. The schedule favors businesses with sufficient scale and predictable sportsbook demand. Smaller licensees may need to narrow their product scope, consolidate, or exit if they cannot cover the higher fixed obligation.
Operator Landscape and Market Share Signals
The Philippine competitive field is better understood as a tiered system than as a flat list of brands. PAGCOR-licensed integrated operators combine casino or land-based assets with sportsbook distribution, while dedicated online platforms depend more heavily on digital acquisition, payments, mobile product design, and recurring wagering activity.
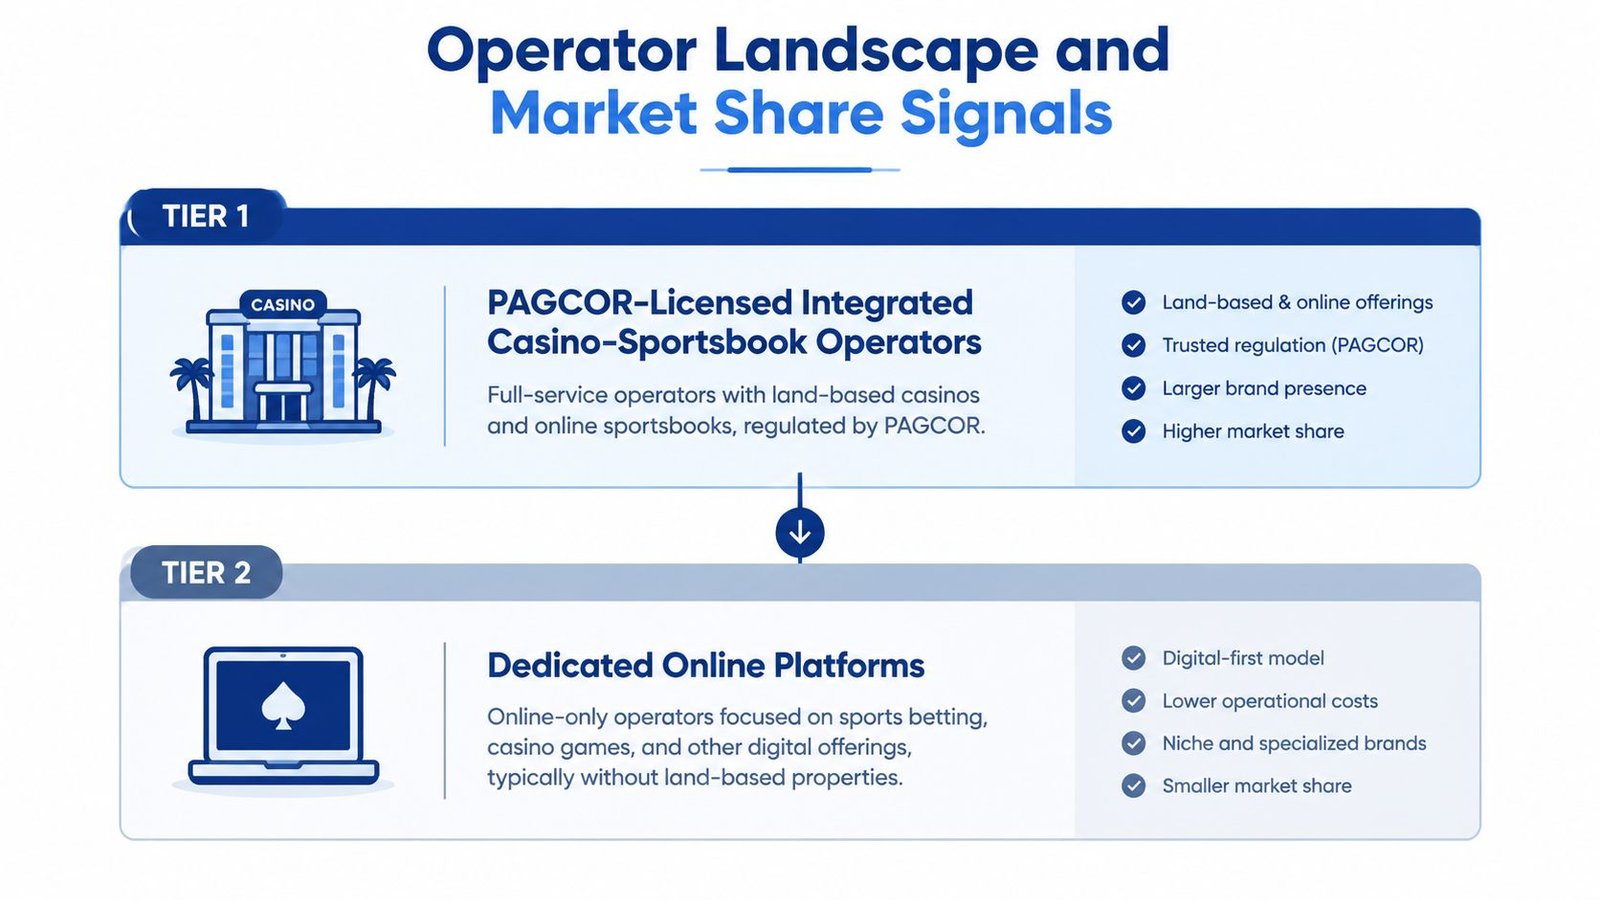
The available data supports a scale advantage for operators that already participate in the larger online pool. Online gaming represented 53.5% of GGR in the first half of 2025, while the minimum monthly benchmark creates a commercial floor that a smaller, digital-only sportsbook must clear. The evidence doesn't identify a complete operator-by-operator market-share ranking, so claims about a specific brand leading mobile sports betting would go beyond the verified record.
A practical comparison
| Operator category | Primary advantage | Main exposure under 2026 fees |
|---|---|---|
| Integrated casino-sportsbook operators | Existing customer relationships and broader cross-product economics | Digital performance can be obscured by bundled reporting |
| Dedicated PAGCOR-licensed online platforms | Focused mobile acquisition and sportsbook product control | Minimum GGR and guaranteed-fee obligations |
| Offshore-facing Asian books | Indirect competition through affiliates and payment routing | Licensing, enforcement, and channel-access risk |
| Suppliers and platform providers | Ability to support odds, payments, CRM, and reporting across operators | Demand depends on licensee viability and compliance requirements |
The distinction between licensed and offshore-facing businesses matters for investors and affiliates. Offshore brands may compete for the same customer attention without carrying the same visible local cost structure, but that comparison isn't a like-for-like measure of regulated market share. Payment routing, affiliate exposure, and enforcement conditions can change the economics quickly.
For licensed operators, the new fee schedule makes scale quality more important than registration volume alone. A large account base that produces low or irregular GGR may not protect a business from the minimum guarantee. Affiliates should also examine whether an operator's revenue comes from live sports, virtual products, or bundled e-games before comparing commissions.
Regulatory administration adds another diligence layer. Businesses working with Philippine licensees should understand PAGCOR B2B accreditation fees and related requirements before treating supplier or platform relationships as interchangeable.
Growth Drivers and Headwinds for Sportsbook Demand
Demand has a clear center of gravity. Basketball and football dominate betting interest in the available independent coverage, while traditional sports betting is reported as the most popular gambling product among surveyed players, with 50% usage. The same market evidence describes a young, mobile-oriented audience, and Ken Research's estimate places mobile transactions at 84% of the broader online wagering market.
That combination supports high-frequency, event-led sportsbook use. Basketball offers repeated fixtures and live markets, while football extends the product calendar across international competitions. Yet demand indicators don't remove margin pressure. The first-quarter 2026 GGR decline and PAGCOR's lower full-year guidance show that participation can remain valuable while total industry revenue contracts.
Demand and supply pull in opposite directions
| Factor | Direction | Revenue implication |
|---|---|---|
| Basketball and football interest | Positive | Supports recurring sportsbook engagement |
| Mobile-first transaction behavior | Positive | Makes app speed, payments, and live odds central to conversion |
| Live sports fee reduction | Positive for live product economics | Improves variable margin before fixed costs |
| Q1 2026 GGR decline | Negative | Signals weaker near-term revenue conditions |
| Higher October minimum guarantee | Negative for smaller books | Raises the break-even requirement |
| Advertising and responsible-gambling scrutiny | Potentially negative | Can restrict acquisition methods and increase compliance workload |
The key analytical distinction is between volume elasticity and margin elasticity. Sportsbook handle can rise because users wager more frequently on mobile events, while operator profit stays flat if incentives, customer-acquisition costs, or guaranteed fees absorb the additional revenue. Conversely, a live-betting fee reduction can improve contribution without producing any increase in customer volume.
Decision point: A demand forecast should show both expected wagering activity and the portion retained after fees, incentives, acquisition, and fixed guarantees.
user acquisition cost analysis for iGaming becomes relevant. Affiliates and operators shouldn't judge growth by registrations or gross betting activity alone. The useful test is whether each acquisition channel produces enough recurring live-sports GGR to cover its variable and fixed obligations.
The resulting outlook is mixed. Mobile access and sport preference create a credible demand base, but 2026 revenue may be volume-led and margin-constrained, especially for operators that enter the October schedule without sufficient scale.
Base Bull and Bear Scenarios for 2026
A single 2026 market-size figure hides the variables that matter most. PAGCOR's PHP 320 billion to PHP 350 billion guidance sets the broad industry boundary, while the first-quarter decline shows why a straight-line growth assumption is weak. Sportsbook volume, online-gambling GGR, and operator margin should therefore be modeled separately.
The table uses PAGCOR's published range where available and labels the remaining fields as analytical assumptions. Sportsbook-only GGR, online share, mobile share, and dollar conversions are not verified outcomes.
| Scenario | Industry GGR (PHP B) | Industry GGR (USD B) | Sportsbook GGR (PHP B) | Online Share | Mobile Share | Key Trigger |
|---|---|---|---|---|---|---|
| Base | 335 | Not verified | 38 to 42, analytical range | 56%, analytical assumption | 84%, broader-market estimate | Fee relief supports live betting, but fixed costs constrain smaller books |
| Bull | Above 365, analytical case | Above 6.5, analytical case | Not verified | Not verified | Not verified | Strong basketball and football engagement with sustained digital demand |
| Bear | 295, analytical case | 5.25, analytical case | Not verified | Not verified | Not verified | Renewed contraction, tighter enforcement, or stronger acquisition restrictions |
Base case
The base case uses the midpoint of PAGCOR Chairman Alejandro Tengco's PHP 320 billion to PHP 350 billion guidance, producing an analytical center of PHP 335 billion. The PHP 38 billion to PHP 42 billion sportsbook range is a modeling band, not a PAGCOR disclosure. It should be replaced once reliable sportsbook-only reporting becomes available.
The channel assumption is constructive for live sports. Lower live-betting fees can support wagering activity, yet the October minimum guarantee reduces the number of viable sub-scale books. That creates a split outcome: handle may increase as mobile users place more live wagers, while GGR and profit remain constrained by fees, incentives, acquisition costs, and fixed guarantees.
Bull case
The bull case requires sustained mobile sportsbook engagement and efficient monetization of live markets. Digital demand must also withstand payment friction and enforcement pressure. The available evidence does not verify e-sports wagering, NBA or PBA monetization, or offshore wallet flows as forecast inputs. They are scenario triggers, not established contributions to 2026 revenue.
A stronger result would therefore come from better conversion of existing demand into retained GGR, rather than from a headline industry number alone. Operators with sufficient scale can absorb fixed obligations more effectively than smaller books.
Bear case
The bear case places total GGR below PAGCOR's published guidance range. That outcome would require further pressure from tighter advertising rules, enforcement action, weaker consumer spending, or restricted acquisition channels. It remains an analytical case, not a verified forecast.
Investors should test each scenario against live-betting take rate, mobile revenue per active account, minimum-fee pass-through, and customer-acquisition cost. User acquisition cost analysis for iGaming helps frame the channel question: registrations and gross betting activity matter only when recurring live-sports GGR covers variable and fixed obligations.
The practical conclusion is mixed. Mobile access and sports preference provide a credible demand base, but 2026 revenue may be volume-led and margin-constrained, particularly for operators entering the October schedule without sufficient scale.
What Operators Affiliates and Investors Should Do Next
The data points to different actions for each participant. Operators need a product-level model. Affiliates need transparent channel attribution. Investors need to separate reported GGR from assumptions embedded in market forecasts.
Operators
Operators should rebuild the sportsbook P&L around the 15% live sports GGR share, while keeping virtual betting at 30%. The model should then test whether monthly GGR clears PHP 15 million before the October change and PHP 20 million afterward, with the corresponding PHP 3 million and PHP 4 million minimum guaranteed fees. PAGCOR's 2026 fee schedule is the relevant regulatory input for this stress test.
An operating plan should also:
- Separate product economics: Track live sports, virtual betting, and e-games independently instead of applying one blended margin.
- Stress monthly demand: Test weak fixture calendars and acquisition slowdowns against the minimum guarantee.
- Protect mobile performance: Measure deposits, withdrawals, odds latency, and live-market engagement by device category.
- Review incentive design: PHP-based deposit incentives should be tested for contribution after fees and guaranteed obligations, not just registration growth.
Affiliates
Affiliates should weight traffic toward regulated operators whose sportsbook terms and payment processes remain clear. The 53.5% online GGR share in H1 2025 supports deeper digital coverage, but it doesn't show that every online operator has the same sports exposure. Commission reporting should therefore distinguish sports GGR from casino, virtual, and e-games revenue where contracts allow.
An operator's movement toward or away from the minimum-fee tier can also act as a commercial signal. Affiliates should monitor payment reliability, offer changes, compliance notices, and traffic-source concentration rather than relying only on headline CPA.
Investors
Investors should pressure-test management forecasts against PAGCOR's PHP 320 billion to PHP 350 billion 2026 guidance and the 16% year-on-year Q1 decline. A dollar-denominated market estimate should be tested for currency sensitivity before it becomes a valuation input, because Ken Research's forecast and PAGCOR's disclosures use different currencies.
Investor filter: The strongest disclosure is sportsbook-specific GGR with a clear split between live sports and bundled digital products.
Top 1 Rank can serve as one market-intelligence reference for tracking regulatory changes, operator developments, and iGaming performance signals. It shouldn't replace licensee filings, PAGCOR disclosures, or direct financial diligence.
The next step is practical. Operators should update their 2026 models before the October fee change, affiliates should audit partner revenue by product and channel, and investors should request sportsbook-only disclosure before assigning a premium to the Philippines opportunity.
For decision-grade planning, download the underlying PAGCOR disclosures, reconcile every sportsbook assumption to reported data, and have commercial, compliance, and finance teams review the model together before committing budget or market-entry capital.





Join thousands of gaming professionals receiving the latest iGaming news, regulatory updates, and market insights.
