


In 2024, legal U.S. sportsbooks accepted approximately $147.9 billion in bets, yet operator revenue was $13.71 billion. That gap is the essential starting point for online gambling market analysis: market scale changes materially depending on whether the metric is wagering volume, retained revenue, or regulated Gross Gambling Yield.
The figure also changes how every other statistic should be read. A reported total is never just a market total. It reflects a defined jurisdiction, product mix, reporting period, licensing perimeter, and revenue convention. At Top 1 Rank, the most useful analysis therefore separates licensed activity from broader estimates and treats regulation as part of the market structure, not as a footnote.
Table of Contents
- Why Online Gambling Market Analysis Matters Now
- How the Online Gambling Market Was Built
- Sizing the Market Through Regulator Data
- Regional Segmentation and the U.S. Sportsbook Case
- The Regulatory Environment Operators Must Navigate
- Revenue Streams and the Products Driving Growth
- The Metrics That Actually Drive Market Performance
- What This Means for Operators, Investors, and Regulators
Why Online Gambling Market Analysis Matters Now
Great Britain's regulated gambling industry generated £16.8 billion in Gross Gambling Yield during the year to March 2025, while online gambling accounted for £7.8 billion. The figures are reported by the Gambling Commission's industry statistics, and they describe a defined regulated market, not every wager placed globally.
That distinction establishes the analytical discipline required. A credible market assessment starts with three questions:
- Who measured the activity? A regulator, operator, government agency, or commercial estimator may use different coverage rules.
- What does the revenue measure mean? Handle, deposits, operator revenue, and GGY are not interchangeable.
- What regulatory perimeter does the figure cover? Licensed activity may exclude offshore, restricted, or unreported transactions.
A common vocabulary for market sizing
Gross betting handle measures the total amount wagered. Operator revenue measures what a sportsbook retains before expenses and taxes. Gross Gambling Yield, or GGY, generally represents stakes retained after winnings and before operating costs. A market can therefore show rising handle without an equivalent increase in revenue if margins, product mix, promotional intensity, or event outcomes change.
This is why two estimates can differ by billions and still be internally correct. One may cover licensed online casino and betting activity in a regulator-defined market, while another may attempt to estimate global activity across jurisdictions with uneven disclosure.
Practical rule: Every market-size figure should carry its definition, geography, period, and reporting source beside it.
For operators, the distinction affects expansion cases, licensing priorities, and acquisition budgets. Investors need it to avoid comparing a sportsbook handle figure with a casino GGY figure. Regulators need it to benchmark safer-gambling outcomes against the activity within their authority.
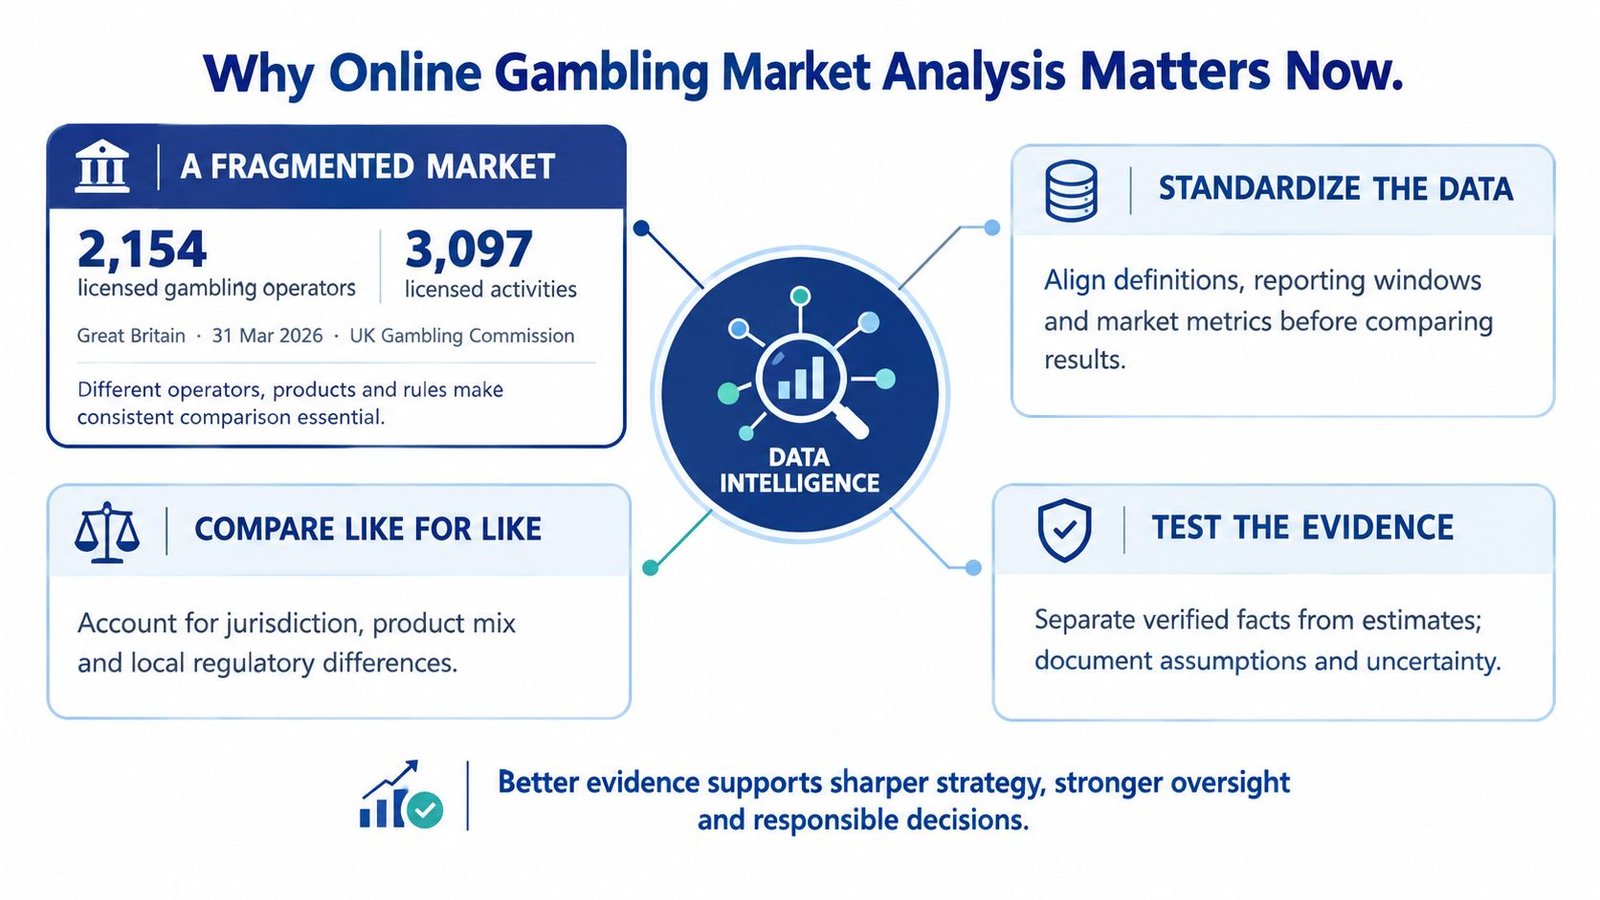
The same framework applies when analysts review PAGCOR regulatory updates for 2026. Regulatory change can alter who is counted, what products are permitted, and how operators report performance. Market analysis becomes useful only after those boundaries are explicit.
How the Online Gambling Market Was Built
Online gambling emerged as a commercial sector through the interaction of internet distribution, licensing innovation, and regulatory experimentation. Historical research identifies ticketing for the Liechtenstein International Lottery in October 1994 as the first online gambling venue reportedly open to the general public. In the same year, Antigua and Barbuda passed its Free Trade & Processing Act, creating a legal framework for licensing online casinos. These milestones are documented in the historical overview of online gaming.
The early market expanded quickly. Historical estimates indicate that gambling websites increased from approximately 15 in 1996 to about 200 in 1997, while online gambling revenue exceeded $830 million in 1998. By 2008, H2 Gambling Capital estimated worldwide online gambling revenue at approximately $21 billion.
Those figures matter less as a continuous global series than as evidence of the sector's underlying structure. Digital distribution allowed operators to reach customers across borders without building a physical venue in each market. Licensing jurisdictions became strategic operating centers, and differences between national regimes shaped where products could be offered and how companies organized their businesses.
Regulation developed unevenly
Australia's Interactive Gambling Act framework, introduced around 2000, illustrates the regulatory divergence that followed. European and Caribbean jurisdictions generally became important licensing or operating centers, while other governments restricted products, limited advertising, or separated online activity from land-based gambling.
The result wasn't a single global market with uniform rules. It was a network of national and regional markets with different definitions of legality, different tax systems, and different reporting quality. That structure still determines how analysts interpret current performance.
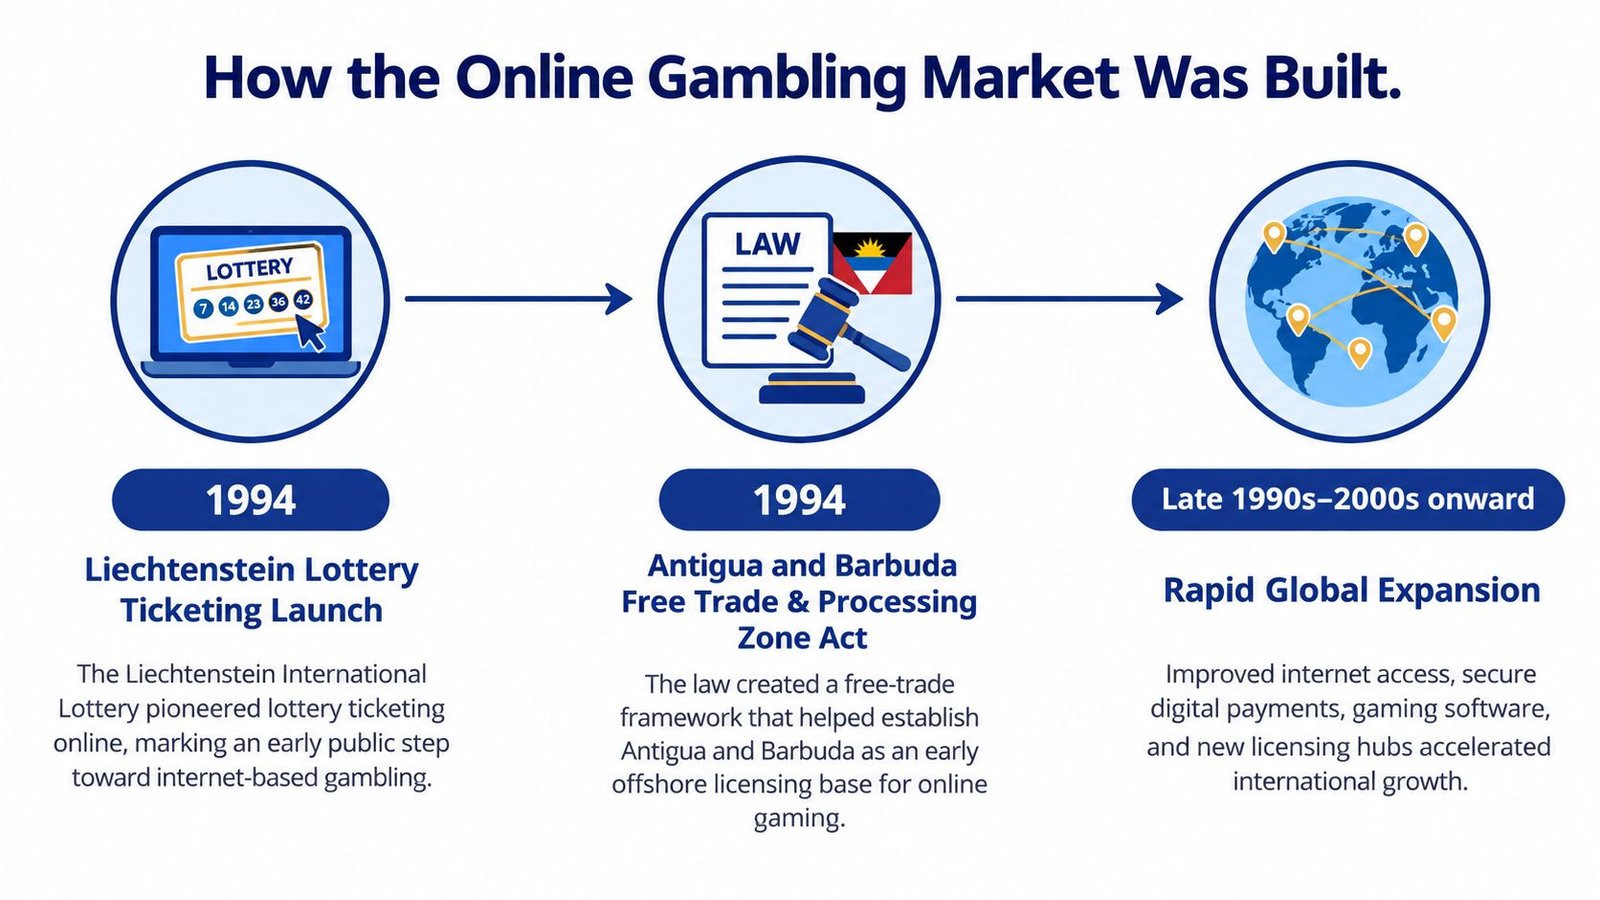
The historical lesson is direct. Technology created reach, but regulation determined the commercial shape of that reach. A modern PAGCOR B2B provider application process belongs in the same analytical story as early Caribbean licensing experiments, because both show how market access depends on an operating framework as much as on consumer demand.
Sizing the Market Through Regulator Data
In July to September 2025, Great Britain's regulated online market generated £1.42 billion in online GGY, up 8% year over year, according to the Gambling Commission's operator data. That figure is useful only if it stays tied to its jurisdiction, reporting window, and regulator definition. It measures licensed, reported activity in Great Britain, not a borderless global total or a broader estimate of gambling demand.
The vertical split gives the headline meaning. Online slots generated £747 million, while real-event betting produced £508 million. Against the reported total, slots accounted for approximately 52.6% of online GGY and real-event betting approximately 35.8%. The balance came from other online products included within the Commission's measured market.
| Period | Online GGY | Real-Event Betting GGY | Online Slots GGY |
|---|---|---|---|
| July to September 2025 | £1.42 billion | £508 million | £747 million |
| October to December 2025 | £1.5 billion | £530 million | £788 million |
The next quarter shows why this breakdown matters. In October to December 2025, online GGY fell 2% year over year, with real-event betting down 18% and slots up 10%, based on the Gambling Commission's market impact data. A reader focused only on the total would miss that the market was not moving in one direction.
This distinction also separates revenue concepts that are often blurred in market commentary. GGY is not handle, and it is not operator profit. It reflects gambling yield before the full cost base, while handle would describe the value of wagers accepted rather than the revenue retained. Keeping those measures separate is basic analytical discipline, especially when analysts compare sportsbook activity with casino-style products across regulated jurisdictions.
Why the vertical split matters
A single online total can mask opposing forces inside the same licensed market. Sports betting revenue can shift with fixture calendars, event outcomes, and hold. Slots often show a different pattern. Neither should be read as a direct profit line, because bonuses, payments, acquisition, and compliance still sit below GGY.
For forecasting, this decomposition improves judgement. Analysts can test whether growth is coming from slots, real-event betting, or another product, instead of applying one market assumption to every vertical. Operators can compare product mix by jurisdiction. Investors can judge whether reported expansion rests on a narrowing revenue base.
Regional Segmentation and the U.S. Sportsbook Case
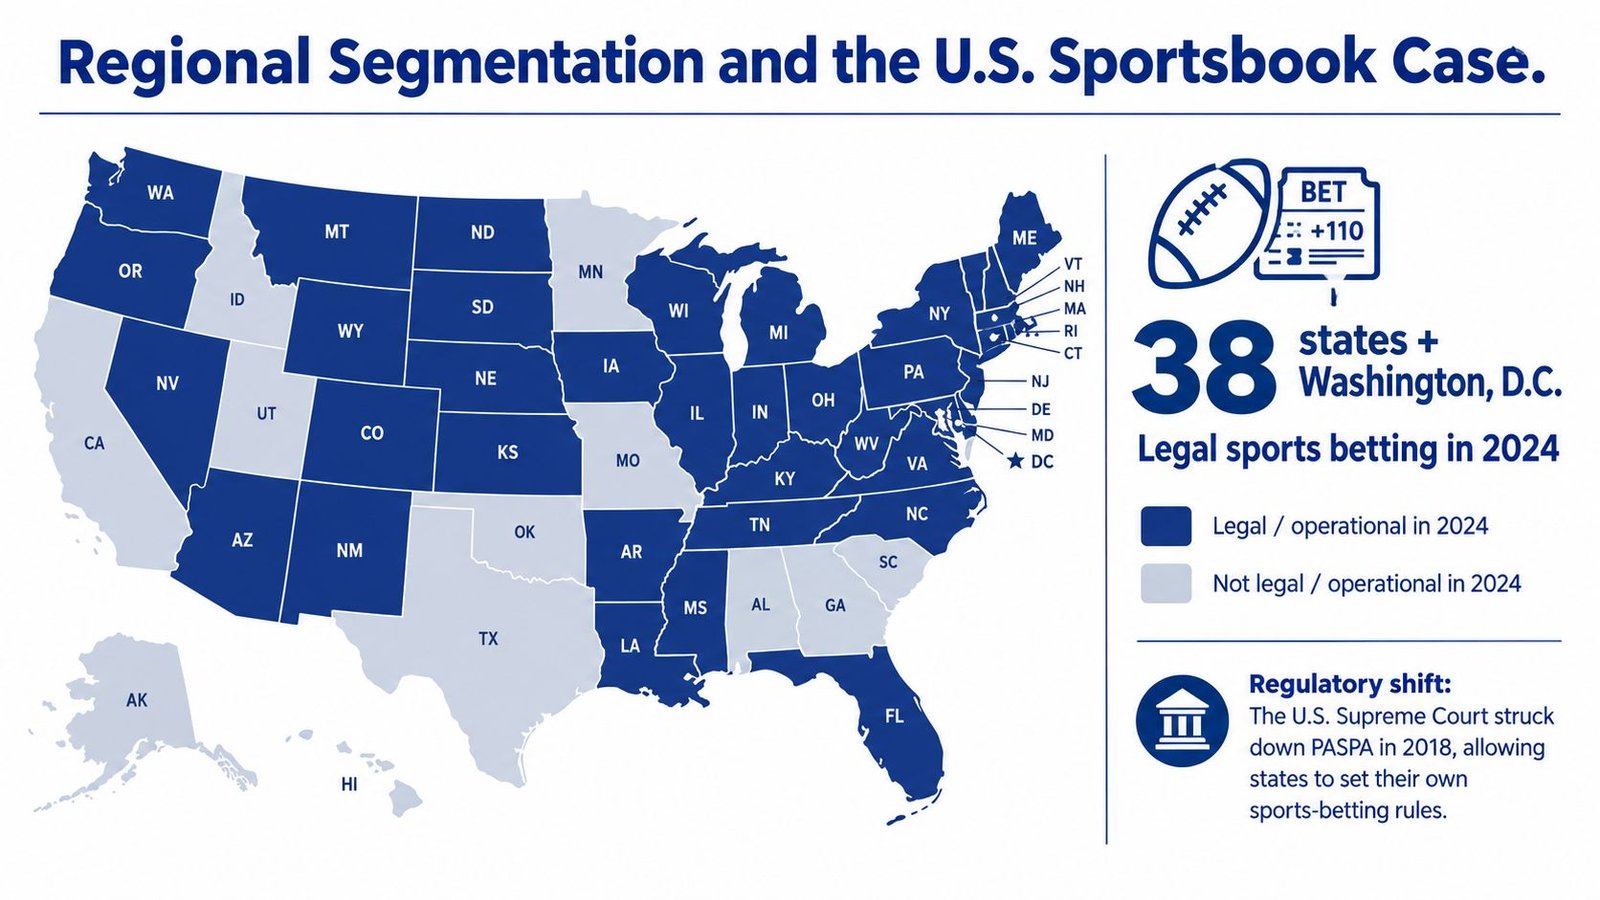
The United States shows how legalization and mobile access can reshape a market while leaving its regulatory structure fragmented. After the Supreme Court's May 2018 decision invalidated the Professional and Amateur Sports Protection Act, individual states gained the ability to authorize sports wagering independently.
During 2024, legal sports betting operated in 38 states plus Washington, D.C. Legal U.S. sportsbooks accepted approximately $147.9 billion in wagers, up 23.6% from the prior year. Sportsbook revenue reached $13.71 billion, up 25.4% from the $11.04 billion record in 2023, according to ESPN's report on U.S. sports betting.
Approximately 95% of the 2024 handle was wagered online. That result makes mobile distribution the dominant channel in the legal U.S. sportsbook market, but it doesn't make the market nationally uniform. Each state can set its own tax, licensing, product, and market-access rules.
New York demonstrates the effect of policy design
New York generated roughly $2.1 billion in sportsbook revenue from more than $22 billion in wagers. Its 51% tax rate produced more than $1 billion in state tax revenue, illustrating how taxation changes the relationship between gross consumer activity, operator economics, and public receipts.
| Metric | U.S. legal sportsbook market in 2024 | New York |
|---|---|---|
| Wagers | Approximately $147.9 billion | More than $22 billion |
| Operator revenue | $13.71 billion | Roughly $2.1 billion |
| Online share | Approximately 95% of handle | Not separately stated |
| Tax outcome | Not stated as one national rate | More than $1 billion |
Handle and revenue must remain separate throughout the analysis. Handle reflects wagering volume. Revenue reflects the amount retained before expenses and taxes. A state with high handle may produce a different operator return from one with a different tax regime, licensing model, or product set.
The wider conclusion is that regional market size depends on launch timing, tax policy, licensing rules, product availability, and mobile penetration. Consumer demand matters, but policy determines how much of that demand enters the licensed market and how the resulting revenue is distributed.
The Regulatory Environment Operators Must Navigate
Online gambling opportunity in Europe doesn't come with a single EU-wide gambling licence. Recommendation 2014/478/EU establishes common consumer-protection principles focused on consumers, players, and children, including the prevention of minors from gambling online, as explained in the European Union's summary of the recommendation.
National licensing systems remain decisive. An operator may use the recommendation as a reference point for regulatory expectations, but market entry still depends on the requirements of the relevant national authority. That can affect age verification, consumer information, responsible-gambling controls, advertising, payments, reporting, and the treatment of vulnerable users.
Revenue is only one operating variable
A market can look commercially attractive while imposing substantial compliance obligations. Operators assessing entry should map:
- Jurisdictional access: Determine whether the product requires a national licence, a supplier approval, or another authorization.
- Player safeguards: Confirm how age controls, self-exclusion, risk monitoring, and consumer information must operate.
- Advertising boundaries: Review the permitted channels, messages, sponsorship arrangements, and affiliate responsibilities.
- Reporting duties: Establish which activity, customer, and financial data must reach the regulator.
The same principle appears outside Europe. Great Britain reports GGY within a defined regulated market, while the United States separates authorization across states. In both cases, analysts need to understand the perimeter before comparing results.
For operators reviewing PAGCOR gambling advertising rules, the commercial question is inseparable from compliance design. A product, campaign, or payment route can support growth only if it remains acceptable within the relevant regulatory framework.
Revenue Streams and the Products Driving Growth
Reported online gambling revenue is only comparable when analysts separate GGY, handle, and product revenue by licensed jurisdiction. That distinction matters because online casino, sports betting, bingo, poker, and newer categories do not convert customer activity into operator revenue in the same way. A sportsbook can post high handle with a modest hold. A casino product can generate steadier revenue from lower transaction values. Bingo and poker depend more heavily on liquidity and repeat participation.
Online casino usually groups slots, table games, and live dealer titles. Sports betting splits between pre-match and in-play wagering, with different margin behavior and event exposure inside the same vertical. Emerging segments such as esports betting or sweepstakes require extra care because legal status, reporting perimeter, and revenue treatment can vary sharply across markets.
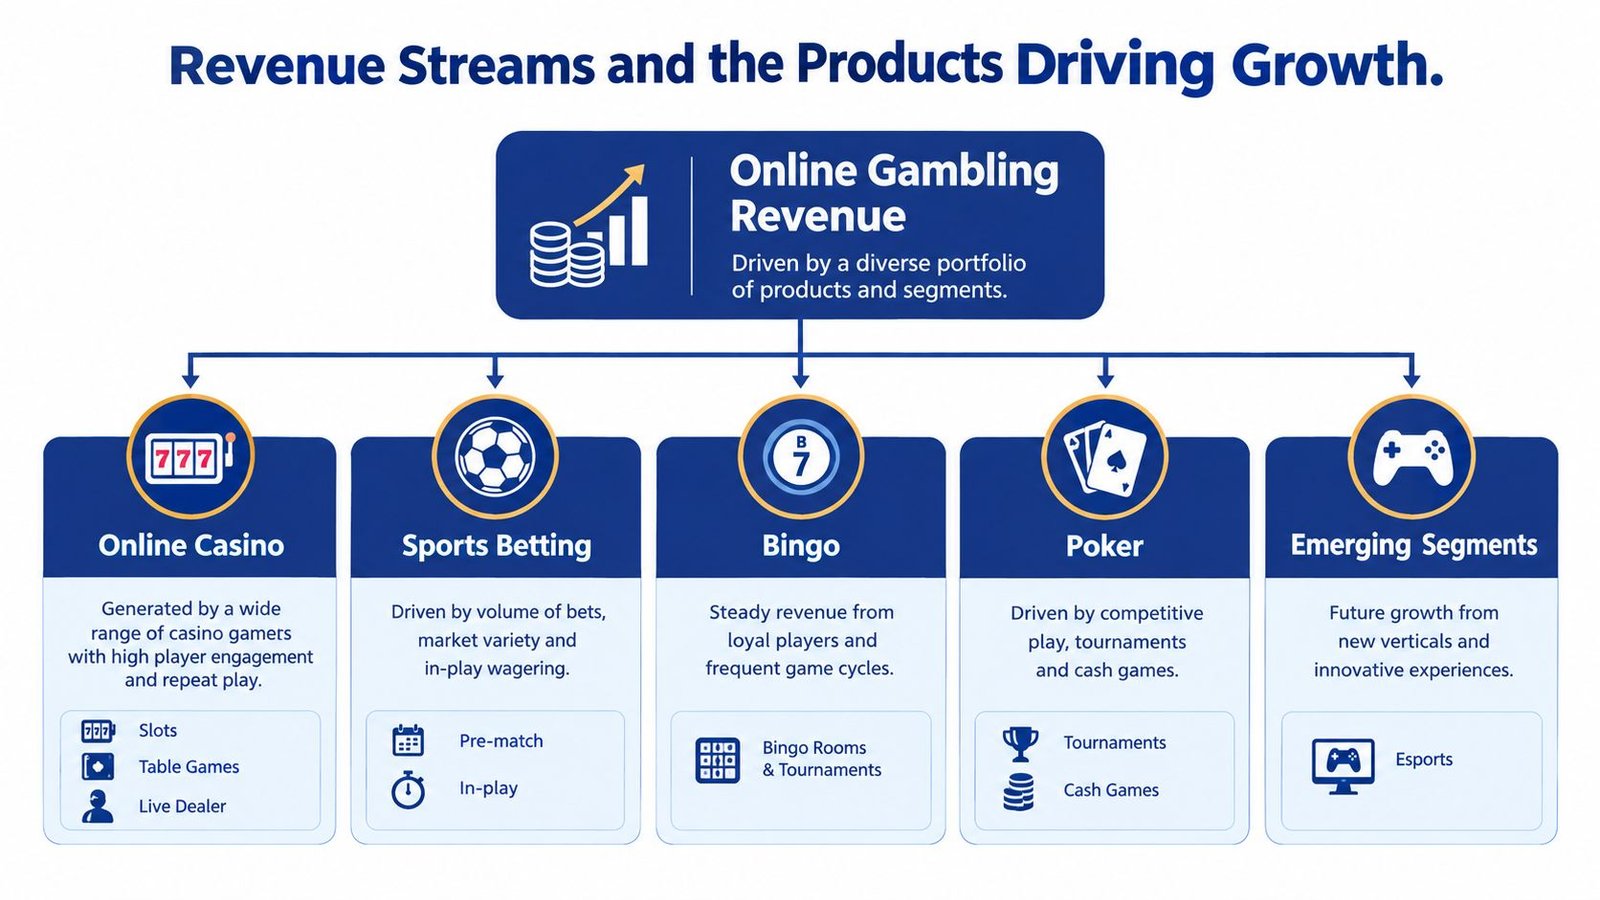
Product mix changes the meaning of growth
The practical question is not only which vertical is larger. It is how a shift in mix changes margin, volatility, and compliance exposure inside the same operator.
Great Britain's reported data, cited earlier in the market-sizing section, already shows that slots and real-event betting do not contribute equally to online GGY. The more useful conclusion here is what happens when customers move between products. A player acquired through a slots offer who later migrates into in-play betting changes the operator's revenue profile, seasonality exposure, promotional cost pattern, and safer-gambling risk controls. The headline market total may barely move while the economics underneath it change materially.
Mobile distribution shapes that mix. Small-screen design affects which products are easy to discover, how quickly customers can place a bet or start a game, and whether balances, limits, and disclosures remain clear during play. Payment setup matters too. Digital wallets, instant bank transfers, and selected crypto integrations can improve conversion, but each route brings its own fraud controls, reconciliation steps, and jurisdiction-specific compliance work.
Personalization has the same dual character. Recommendation engines and personalized promotions may improve discovery and retention, yet product targeting cannot be treated as a purely commercial layer. Segmentation logic, player-risk signals, and intervention rules need to align with safer-gambling obligations.
For product teams, the strongest analysis links acquisition, activation, vertical mix, and retention economics into one model. Operators comparing product categories can also review online casino games in the Philippines as a market-context example, while keeping local product descriptions separate from licensed revenue reporting.
The Metrics That Actually Drive Market Performance
Transaction volume can rise while market revenue falls. Great Britain's October to December 2025 data demonstrates the problem: online GGY was £1.5 billion, down 2% year over year, even as total bets and spins increased 6% to 27.4 billion. Average monthly active accounts declined 2% to 12.7 million, according to the Gambling Commission's market impact release.
The divergence means that engagement counts cannot stand alone as evidence of expansion. More bets or spins may reflect higher frequency among fewer customers, lower yield per transaction, product migration, or a change in the balance between sportsbook and slots.
A practical productivity dashboard
The most useful dashboard combines volume, yield, customer breadth, and product mix:
- GGY per active account: Tests whether operators are generating more or less value from the measured customer base.
- GGY per bet or spin: Shows whether transaction growth is producing equivalent yield.
- Hold percentage: Separates wagering volume from retained sportsbook revenue.
- Frequency: Identifies whether activity is broad-based or concentrated among highly active accounts.
- Mix migration: Tracks movement between betting, slots, casino, bingo, poker, and other products.
Slots provide a further example. During the same period, slot spins rose 7% to 25.7 billion, while average monthly slot accounts increased 5% to 4.6 million. Slot GGY increased 10% to £788 million, whereas real-event betting GGY fell 18% to £530 million.
The dashboard needs deeper cuts
Account-level metrics should be segmented by product, jurisdiction, cohort, and customer-risk segment. Analysts can then distinguish broad adoption from concentration, and revenue growth from changes in the behavior of a smaller high-value group.
Measurement principle: Frequency is an engagement metric, not a profitability metric and not a harm metric by itself.
For operators, customer acquisition cost should sit beside these productivity measures, not in a separate report. A user acquisition cost framework becomes more informative when connected to GGY per active account, retention, payment expense, bonuses, and compliance costs.
Regulators can also monitor combinations rather than isolated indicators. Rising frequency alongside falling account counts may warrant closer review of concentration and affordability risks, but the data still requires contextual interpretation. Engagement and harm are related analytical questions, not identical measurements.
What This Means for Operators, Investors, and Regulators
The evidence supports a decision framework built around perimeter, yield, mix, productivity, and compliance. It doesn't support treating online gambling as one homogeneous global market.
Operators
Operators should size expansion through the licensed opportunity that can be served. That requires a jurisdiction-by-jurisdiction view of product permissions, tax, payments, reporting, safer-gambling controls, and mobile access.
A strong operating model separates sportsbook handle from retained revenue and tracks casino performance independently. The British data shows why vertical diversification matters, but diversification alone doesn't guarantee profitability. Acquisition costs, bonuses, payment fees, customer support, and compliance spending can change the economic result after GGY is reported.
Operators also need an account-level view. If transaction volume rises while active accounts fall, aggregate growth may depend on higher frequency among a narrower base. That pattern changes retention strategy, risk monitoring, and affordability controls.
Investors
Investors should avoid country labels as a substitute for market structure. Exposure is better modeled by vertical mix, tax regime, licensing design, mobile penetration, and disclosure quality.
A sportsbook handle figure isn't directly comparable with casino GGY. Nor is a regulator-reported total automatically equivalent to an industry estimate that includes activity outside the regulator's perimeter. Investment models should preserve those distinctions through every scenario.
Regulators
Regulators can use GGY, active accounts, transaction frequency, and product migration to monitor market performance without equating engagement with harm. The most informative signals emerge from combinations, particularly when rising activity coincides with declining customer breadth or greater concentration.
The next market cycle will raise harder questions. AI personalization may improve product relevance while increasing scrutiny of targeting and player protection. Payment-rail diversification may alter unit economics and monitoring requirements. Esports betting and sweepstakes may expand the product perimeter, but their licensing and reporting treatment will determine whether growth becomes visible in official data.
Decision test: A market opportunity is credible only when its revenue definition, regulatory perimeter, product mix, and compliance cost are visible at the same time.
That is the standard Top 1 Rank applies to online gambling market analysis. Operators, investors, and regulators can use the framework to compare markets without confusing volume for yield, visibility for legality, or activity for sustainable performance.
For continuing coverage of global iGaming intelligence, market performance, regulation, compliance, sportsbook economics, online casino products, and technology, visit Top 1 Rank and use its research to support better-informed market decisions.





Join thousands of gaming professionals receiving the latest iGaming news, regulatory updates, and market insights.
